
SOXL Stock After the 63% Crash: The Math Traders Missed

 Prefer us on Google


SOXL stock closed at $144.95 on Aug 14, 2026 — less than half its 52-week high of $302.00, and more than six times its 52-week low of $23.66. That range tells you everything about the instrument. In thirteen months, the Direxion Daily Semiconductor Bull 3X Shares went from a fund almost nobody wanted to a fund almost nobody could hold, and back again.
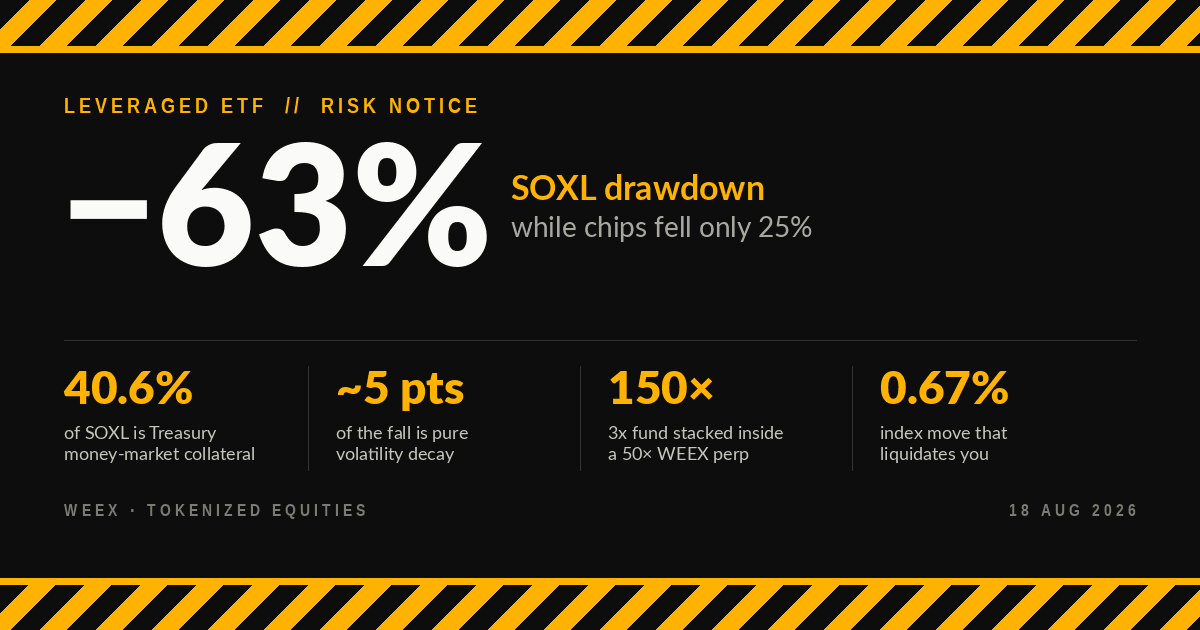
The part most coverage gets wrong is the drawdown itself. Since the semiconductor sector peaked on June 22, 2026, chip stocks fell roughly 25%. SOXL fell about 63%. Three times 25% is 75%, so on the surface the fund did better than advertised. That comparison is a trap, and understanding why is the difference between trading SOXL stock and being traded by it.
SOXL Stock Price Today and the 2026 Round Trip
Here is what the fund looks like as of mid-August 2026.
| SOXL stock: key data | Value | As of |
|---|---|---|
| Last close | $144.95 (−0.28%) | Aug 14, 2026 |
| 52-week range | $23.66 – $302.00 | Aug 14, 2026 |
| Assets under management | $24.25B | Aug 13, 2026 |
| Shares outstanding | 167.30M | Aug 13, 2026 |
| Daily volume | 38.4M shares | Aug 14, 2026 |
| Expense ratio | 0.75% | Aug 2026 |
| Beta | 5.76 | Aug 2026 |
| Index tracked | NYSE Semiconductor Index | — |
| Inception | Mar 11, 2010 | — |
Source: StockAnalysis.com / Finnhub, Aug 13–14, 2026.
Two numbers deserve attention. AUM of $24.25 billion means SOXL is no longer a niche product — it is one of the largest leveraged funds in existence, and the daily rebalancing flows it generates are now big enough to move the underlying chip names into the close. And a beta of 5.76 against the broad market, not 3.0, is the honest description of what you are holding: 3x on a sector that is itself roughly twice as volatile as the S&P.
The year-to-date picture is uglier than the recent bounce suggests. SOXL is down about 15.5% in 2026, against roughly −4% for the unleveraged SOXX. Yet in the first week of August it rallied 27.98%, including a single session up 18.55% against SOXX's 6.30% — an almost perfect 3x day. Both facts are true. That is the whole problem.
Why SOXL Fell 63% While Chip Stocks Lost 25%
The naive expectation — index down 25%, so a 3x fund down 75% — is wrong, because leverage compounds daily rather than applying once to the total move. Run a smooth-path decline through the compounding and you get roughly (1 − 0.25)³ = 0.42, or about −58%. That is the number SOXL "should" have printed if the sector had fallen in a straight line.
It printed −63%. The five-point gap is volatility decay: the cost of the daily reset chewing through a choppy path instead of a clean one.
| Peak (Jun 22, 2026) to late July | NYSE Semiconductor Index | SOXL |
|---|---|---|
| Actual decline | −25% | −63% |
| Naive "3× the move" guess | — | −75% |
| Smooth-path 3× compounding | — | ~−58% |
| Decay cost vs smooth path | — | ~5 points |
| Gain needed to reclaim the peak | +33% | +170% |
That last row is the one to sit with. Chips need a 33% recovery to get back to June. SOXL needs 170%. A trader who is exactly right about the direction of the semiconductor cycle over the next year can still finish underwater in SOXL stock, because the recovery bar moves faster than the sector does.
The long record says the same thing more politely. Over five years, SOXL returned 545.48% against 346.78% for SOXX — about 1.6x the return for 3x the daily risk and 3x the drawdown depth. You are not being paid 3x. You are being charged 3x.
What SOXL Actually Holds: 41% Cash, 8% Swaps
Pull the holdings file and the fund looks nothing like a chip portfolio.
| Holding type | Weight | Examples |
|---|---|---|
| Cash and money-market funds | 40.60% | Goldman Fin'l Sq Treasury (12.29%), Dreyfus Gov't Cash (12.01%) |
| ICE Semiconductor Index swaps | 8.13% | Three separate swap lines |
| Direct chip equities (top 25) | 55.31% | NVDA 5.90%, MU 5.41%, AMD 5.17%, AVGO 5.17%, INTC 3.64% |
Source: StockAnalysis.com / Finnhub holdings file, as of Aug 13, 2026. Weights sum above 100% because swap notional exceeds fund equity — that overhang is the leverage.
Roughly 41 cents of every dollar in SOXL sits in Treasury money-market funds. That is collateral posted against the swaps that manufacture the leverage, and it is the mechanism nobody mentions when they describe SOXL stock as "3x the chip sector." You own a small basket of chip stocks, a large pile of Treasuries, and a set of total-return swaps with bank counterparties. The 0.75% expense ratio does not include the financing spread embedded in those swaps, which is why the real drag on a held position runs meaningfully above the headline fee.
Total holdings: 49, with the top 10 at 65.87%. The equity sleeve is concentrated enough that Nvidia, Micron, AMD and Broadcom guidance effectively sets the fund's path.
-- Price
SOXL vs SOXX: Which One Fits Which Holding Period
| SOXX | SOXL | |
|---|---|---|
| Leverage | 1× | 3× daily, reset at each close |
| 2026 YTD (to Aug) | ~−4% | ~−15.5% |
| 5-year return | 346.78% | 545.48% |
| Peak-to-trough, Jun–Jul 2026 | −25% | −63% |
| Sensible holding period | Months to years | Hours to days |
| Decay risk | None | Compounds with realized volatility |
The better reading is not "SOXL is bad." It is that the two funds answer different questions. SOXX answers do I want the semiconductor cycle in my portfolio. SOXL answers do I want the next four trading sessions in the semiconductor cycle, amplified. Confusing the second for the first is how the 2026 drawdown caught so many holders.
Trading SOXL Around the Clock Through the SOXL-USDT Perp
Here is where the crypto-market route diverges from a brokerage account, and where the risk arithmetic gets genuinely dangerous.
SOXL stock trades only during NYSE hours. WEEX lists a SOXL-USDT perpetual futures contract that trades continuously, USDT-margined, with leverage available up to 50×. The bear counterpart, SOXS-USDT, is capped at 20× — an asymmetry worth noticing, since it tells you which side of the chip trade carries the heavier crowd.
Now stack the two layers of leverage.
| Route | Effective leverage on the chip index | Index move that erases 100% of margin |
|---|---|---|
| SOXX shares | 1× | −100% |
| SOXL stock | 3× (daily) | ~−33% |
| SOXL perp at 5× | 15× | ~−6.7% |
| SOXL perp at 10× | 30× | ~−3.3% |
| SOXL perp at 50× | 150× | ~−0.67% |
Before fees and funding; liquidation triggers before margin reaches zero, so the real thresholds are tighter.
At maximum leverage, a two-thirds of one percent move in the NYSE Semiconductor Index is a full loss. The chip index has moved more than that before breakfast on most days in 2026. If you use this contract, the honest maximum for a swing position is low single-digit leverage, and you should know exactly how adding or removing margin shifts your liquidation price before you size anything.
What traders usually miss: the perp keeps trading when the NYSE is closed, but the thing it references does not. Over a weekend or an overnight gap, the perpetual price moves on positioning and funding with no live underlying market to arbitrage against — then Monday's NYSE open can reprice SOXL through your stop in a single print. Wide funding and thin weekend books are where leveraged holders on both sides get taken out, not at the levels they charted.
Is SOXL Stock a Good Investment Right Now?
Not as an investment — the structure rules it out, and Direxion says as much in its own literature. As a trade, the setup at $144.95 is a legitimate but demanding one: the sector is down 25% from its June peak, the fund is down 63%, and if the AI capex cycle re-accelerates the fund's convexity works in your favor from a lower base.
The catch is that the same convexity requires a trending market, and post-crash tape is usually the opposite. High realized volatility is the enemy of a daily-reset fund even inside an uptrend. Analyst scenario ranges for end-2026 span roughly $115–$165 on the bear side and $210–$285 on the base case, but point forecasts on a 3x product are close to meaningless — the path determines your return, not the destination. Two traders with an identical view on chips can end the same quarter 40 points apart.
If you want a full breakdown of the fund's mechanics before deciding, WEEX's SOXL stock explainer covers the daily-reset design in detail.
The Bottom Line on SOXL Stock
The number that should govern your position is not $144.95 or $302.00. It is 170% — what SOXL stock needs to return just to undo a 25% sector correction. Enter with a defined exit, size for the volatility rather than the conviction, and treat every session you hold it as an active decision. Ready to look at the contract specs? Review SOXL-USDT on WEEX before committing margin.
FAQ
1. Why did SOXL stock fall 63% when chip stocks only lost 25%?
Because 3x leverage compounds daily rather than applying once to the whole move. Compounding a smooth −25% decline at 3x gives roughly −58%; the extra five points came from volatility decay as the fund reset its exposure through a choppy tape.
2. What does SOXL actually hold?
As of Aug 13, 2026: about 40.6% in Treasury money-market funds and cash, 8.13% in ICE Semiconductor Index swaps, and the rest in chip equities led by Nvidia (5.90%), Micron (5.41%), AMD (5.17%) and Broadcom (5.17%). The cash is collateral for the swaps that create the leverage.
3. Is SOXL stock a good long-term investment?
No. The daily reset makes it structurally unsuited to buy-and-hold. Over five years SOXL returned 545.48% versus 346.78% for the unleveraged SOXX — about 1.6x the return for 3x the risk.
4. How can I trade SOXL outside US market hours?
WEEX lists a SOXL-USDT perpetual futures contract that trades continuously with leverage up to 50×, alongside SOXS-USDT at up to 20×. Note that the underlying ETF still only trades during NYSE hours, so overnight and weekend gap risk is real.
5. What is the difference between SOXL and SOXS?
SOXL targets +3x the NYSE Semiconductor Index's daily return; SOXS targets −3x. Both reset daily and both lose value to volatility decay over longer holding periods, which is why holding one as a "hedge" against the other still bleeds.
Risk Warning
SOXL is a 3x leveraged ETF and among the highest-risk instruments available to retail traders. Its daily reset means returns over any period longer than one session can differ sharply — usually unfavorably — from three times the sector's move, and it has already drawn down 63% in 2026 against a 25% sector decline. Trading SOXL exposure through a perpetual futures contract stacks a second layer of leverage on the first: at 50× on a 3x fund, a 0.67% move in the chip index erases the position before fees. Specific risks include volatility decay and path dependence, concentration in a handful of semiconductor names, swap counterparty and financing costs on top of the 0.75% expense ratio, overnight and weekend gap risk while the underlying NYSE market is closed, funding-rate costs on perpetual positions, and liquidation. You may lose part or all of your capital. Size positions to the volatility, use stop-losses, and do not commit funds you cannot afford to lose.
This content is provided for general informational purposes only and doesn't constitute financial, investment, legal, or tax advice. Any events, rewards, online promotions, or related information mentioned herein should not be considered a recommendation, solicitation, or invitation to purchase, sell, trade, or otherwise deal in any crypto assets. Crypto assets are highly volatile and may result in loss. The availability of WEEX services, products, and related events may vary by region. You are responsible for ensuring that your participation is in accordance with applicable local laws and regulations.
You may also like
Best Crypto Apps for Beginners: The Five Features That Actually Matter on Your Phone
WEEX Passkey Now Secures Withdrawals: The 4 Actions It Covers
Stock Market Crash Risk in 2026: The Warning Signs Worth Watching
XST Coin Explained: Two Tokens Share One Ticker, Check Which One
SPY Stock in 2026: What the Rebound to Record Highs Is Hiding
What Is Blockchain and How Does It Work? A Transaction Traced
How to Buy Crypto with PayPal: The Custody Catch Most Beginners Miss
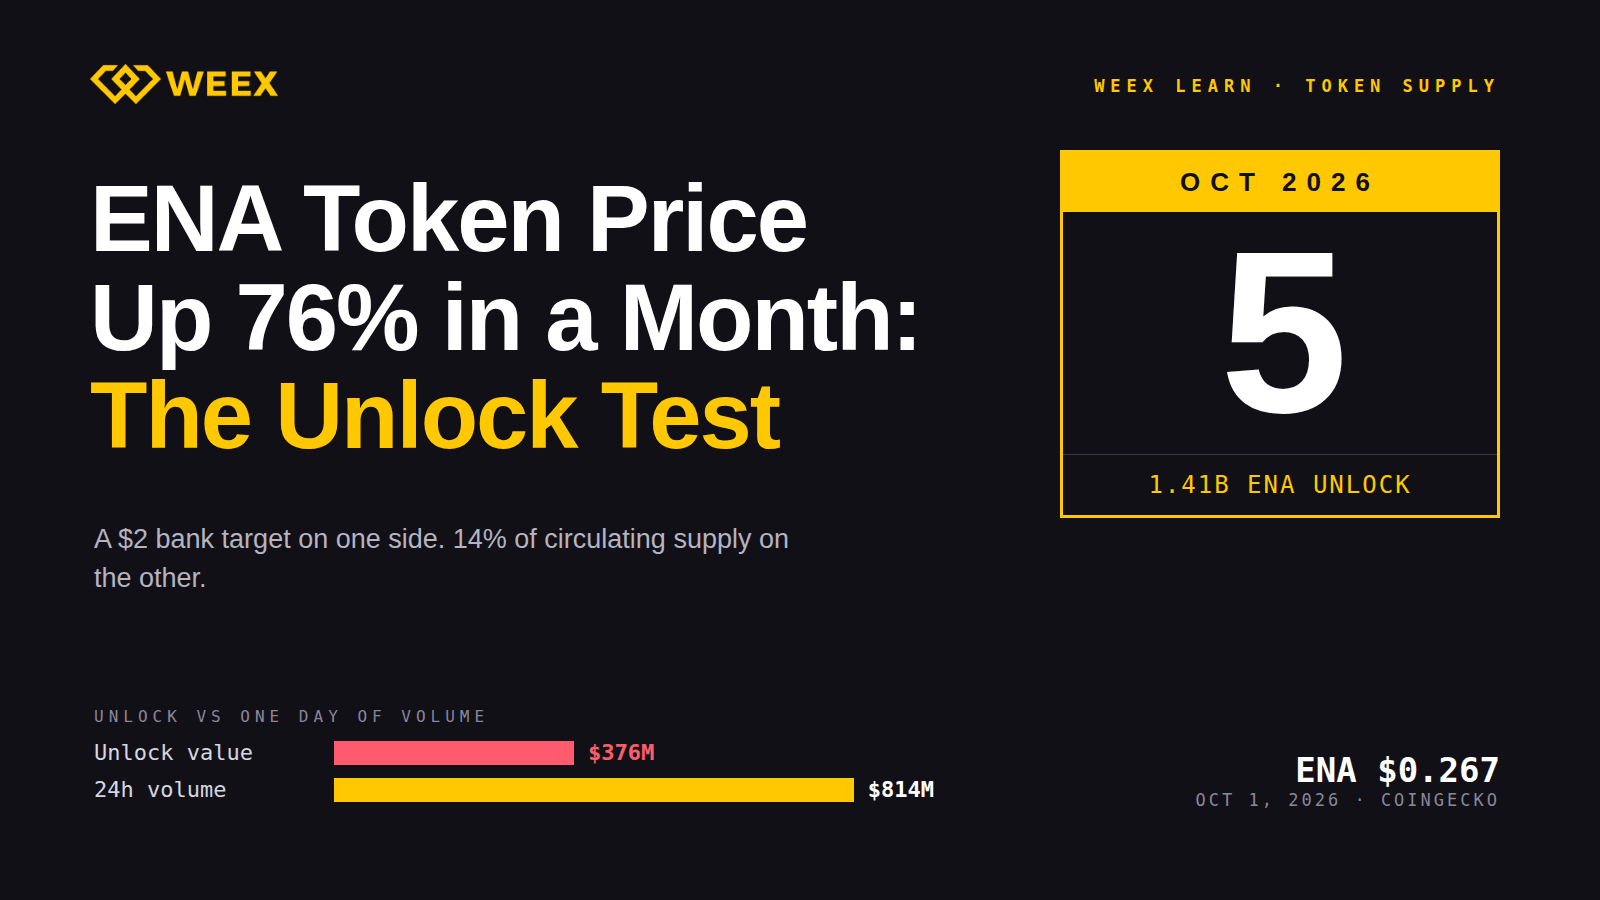
ENA Token Price Up 76% in a Month: The October 5 Unlock Test
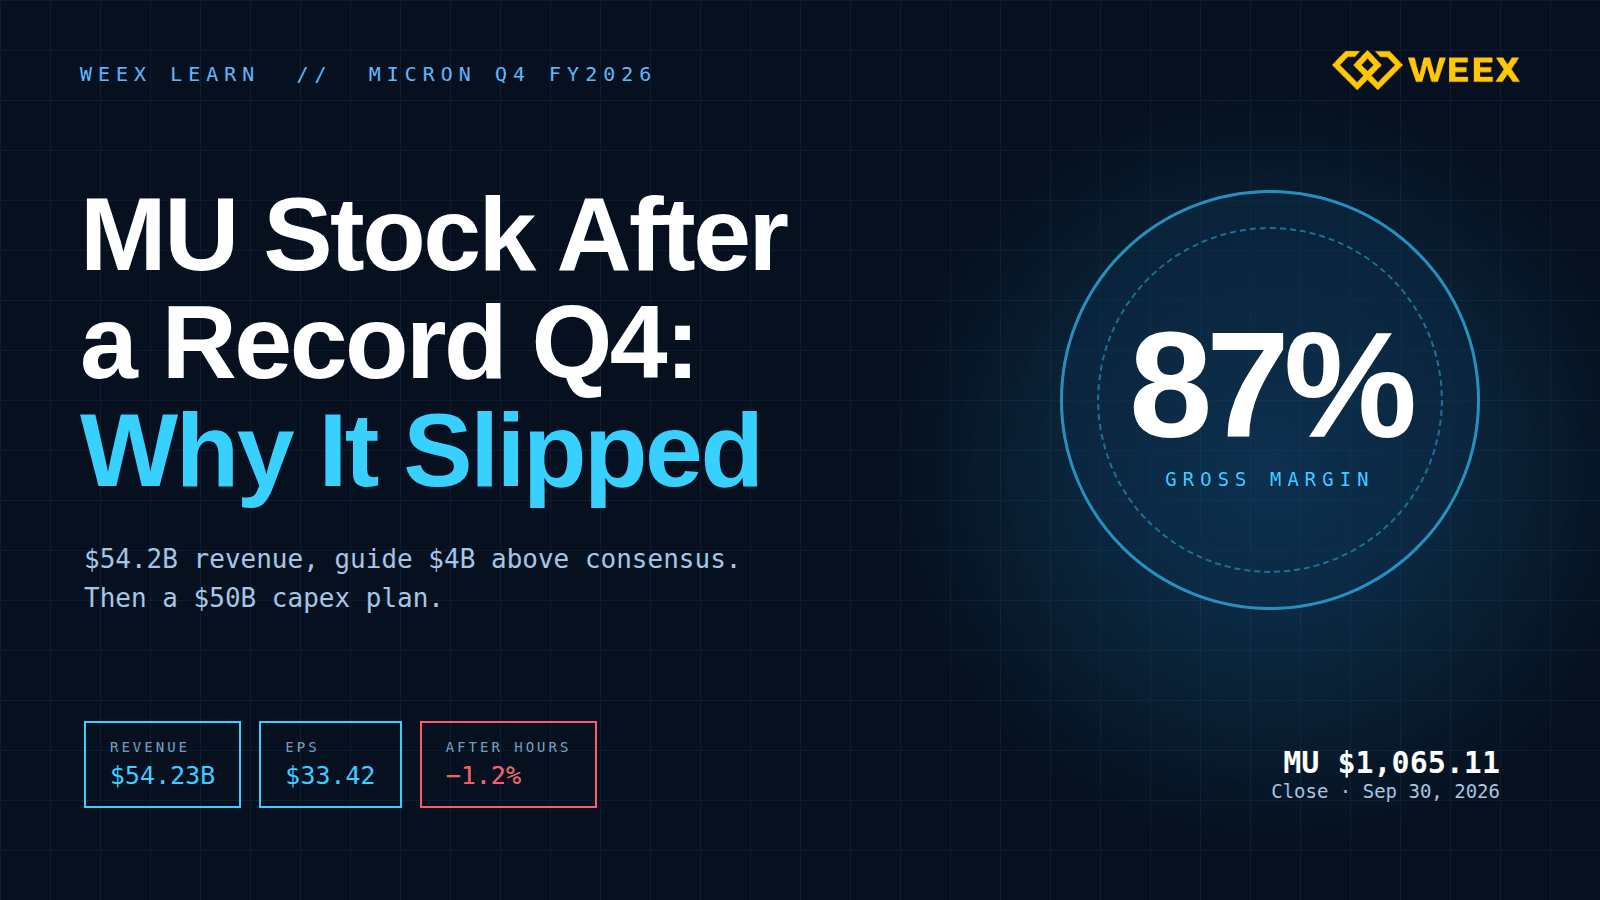
MU Stock After a Record Q4: Why Micron Slipped on a Huge Beat
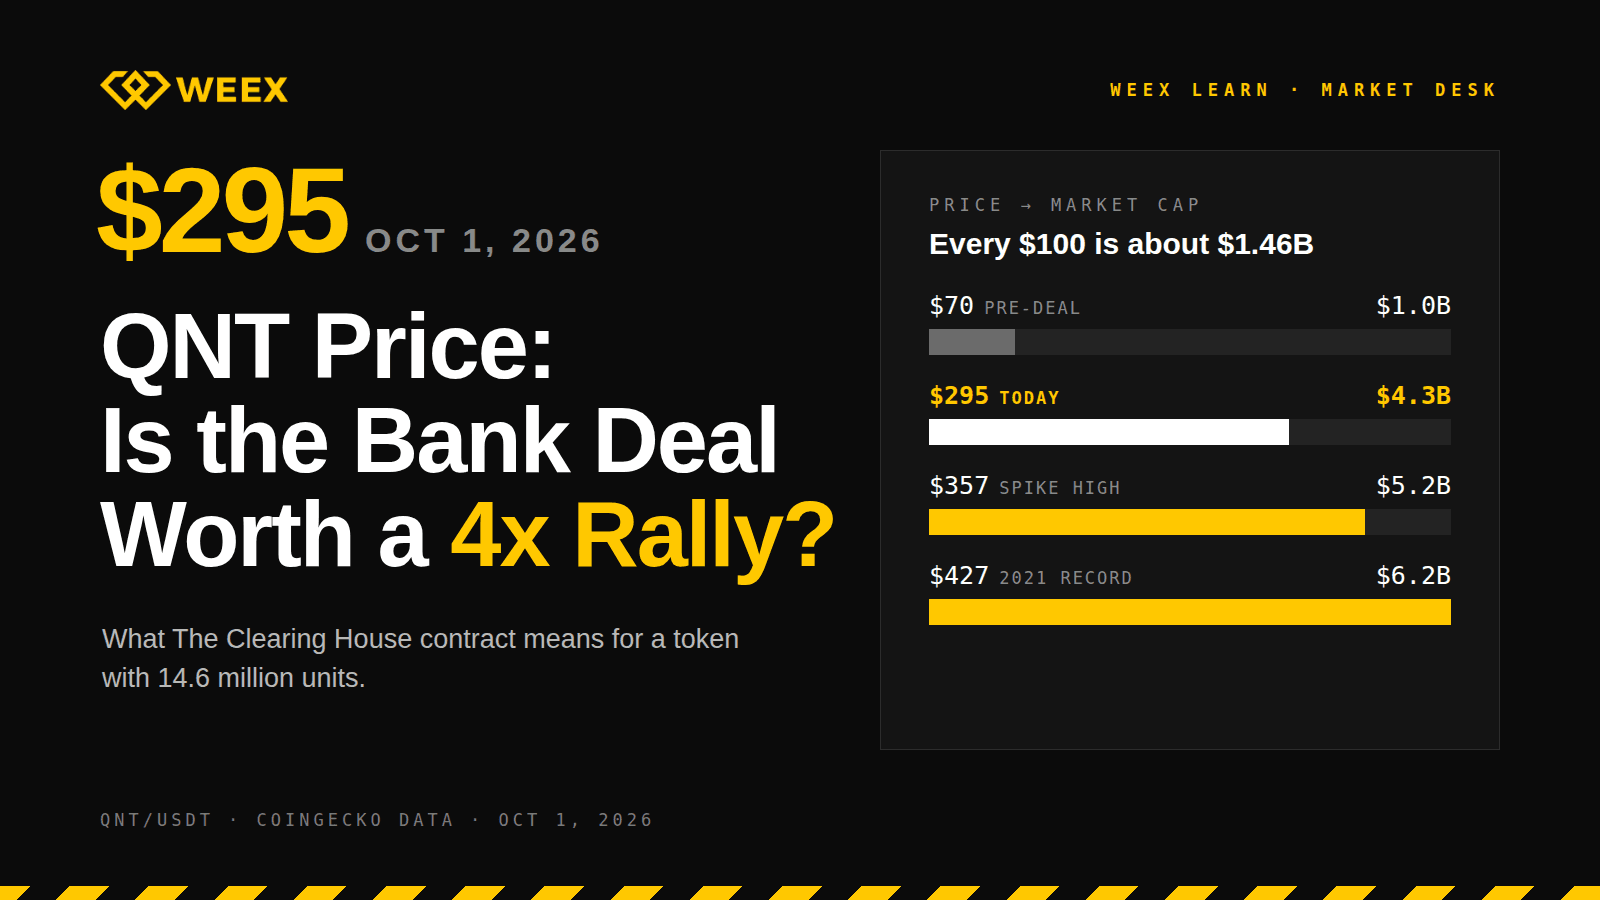
QNT Price Near $295: Does the Bank Deal Justify a 4x Rally?
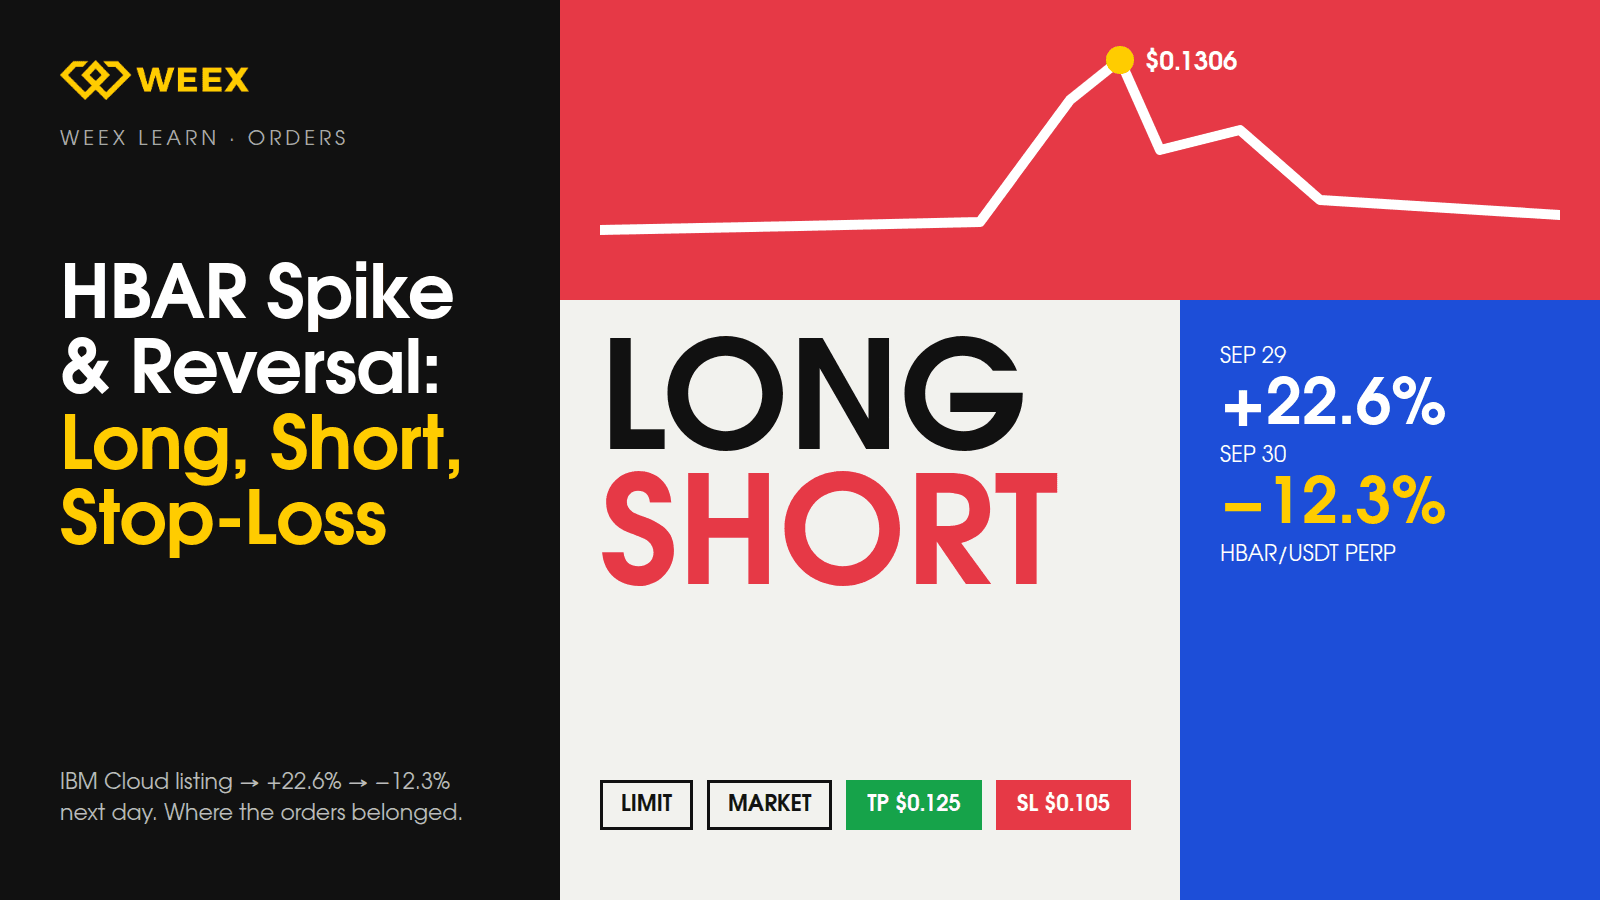
HBAR Price Spike and Reversal: Long, Short, and Stop-Loss Orders
QNT Futures After a 280% Rally: Leverage and Liquidation Math
XRP Upgrade Update: XRPL Batch Slips to Oct 9 and What Changes
Safest Crypto Wallet in 2026: Matching Wallet Type to the Threat You're Actually Worried About
No KYC Crypto Wallet: 6 Picks and 5 Places Your ID Still Leaks
2Z Token Unlock on October 2: What 1.66B DoubleZero Tokens Mean
Best Decentralized Crypto Wallet for Beginners: What Self-Custody Really Asks of You
UNI Futures: How to Set Take-Profit and Stop-Loss After a 2x Run
QNT Futures: Funding Rate and Long vs Short After a 4x Rally
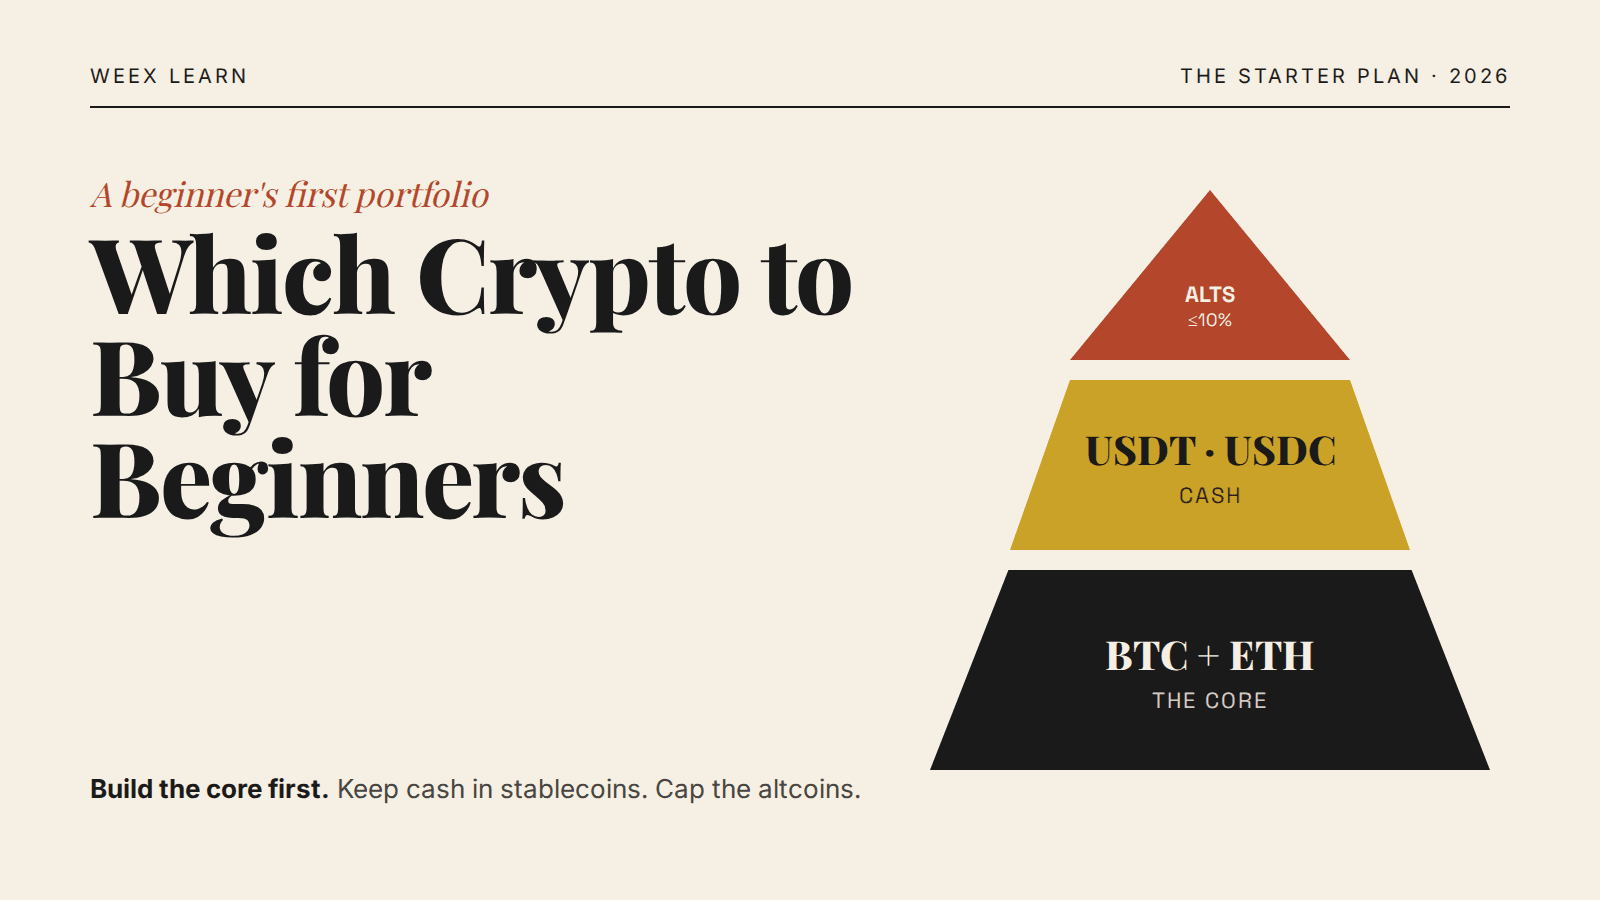
Which Crypto to Buy for Beginners: A Simple 3-Tier Starter Plan
How to Get a Crypto Wallet: Pick, Set Up, and Fund It Safely
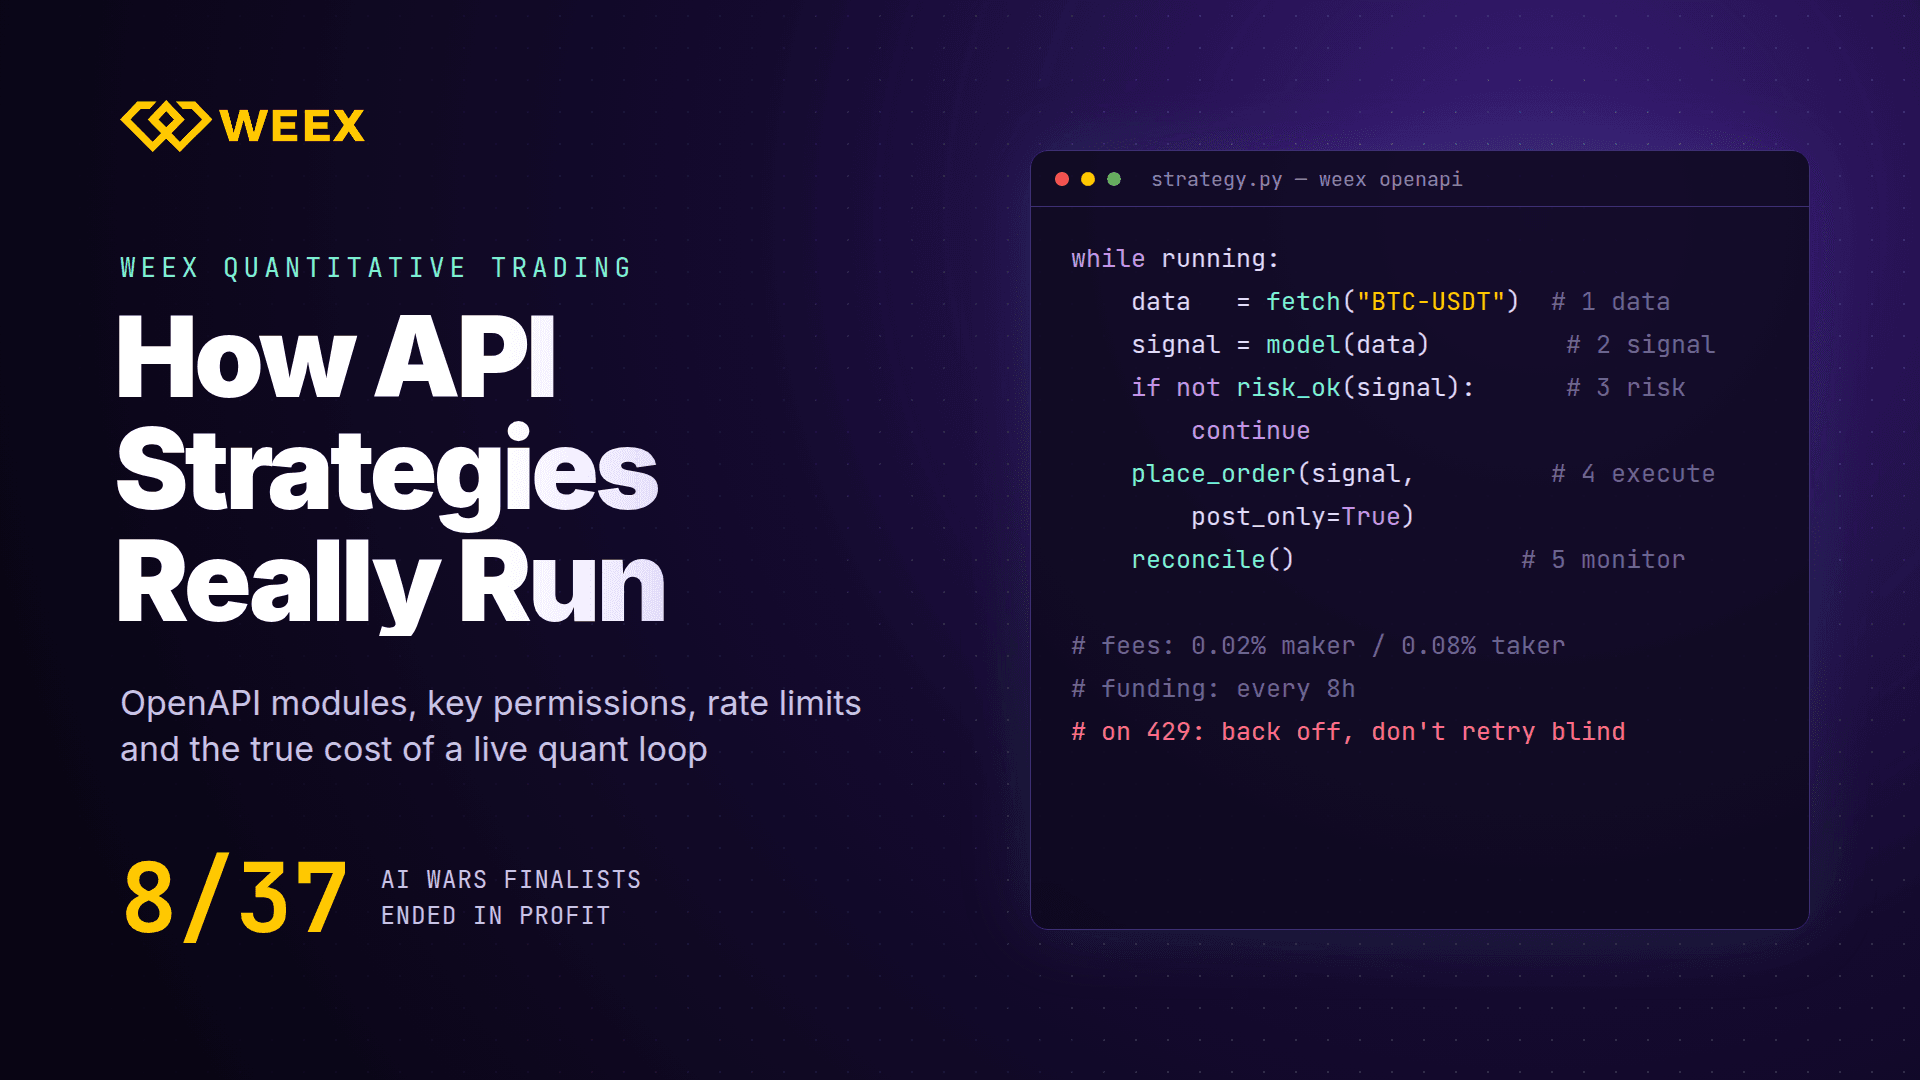
WEEX Quantitative Trading: How API Strategies Run in Practice

WEEX Strategy Trading: 4 Ways to Automate Your Crypto Trades
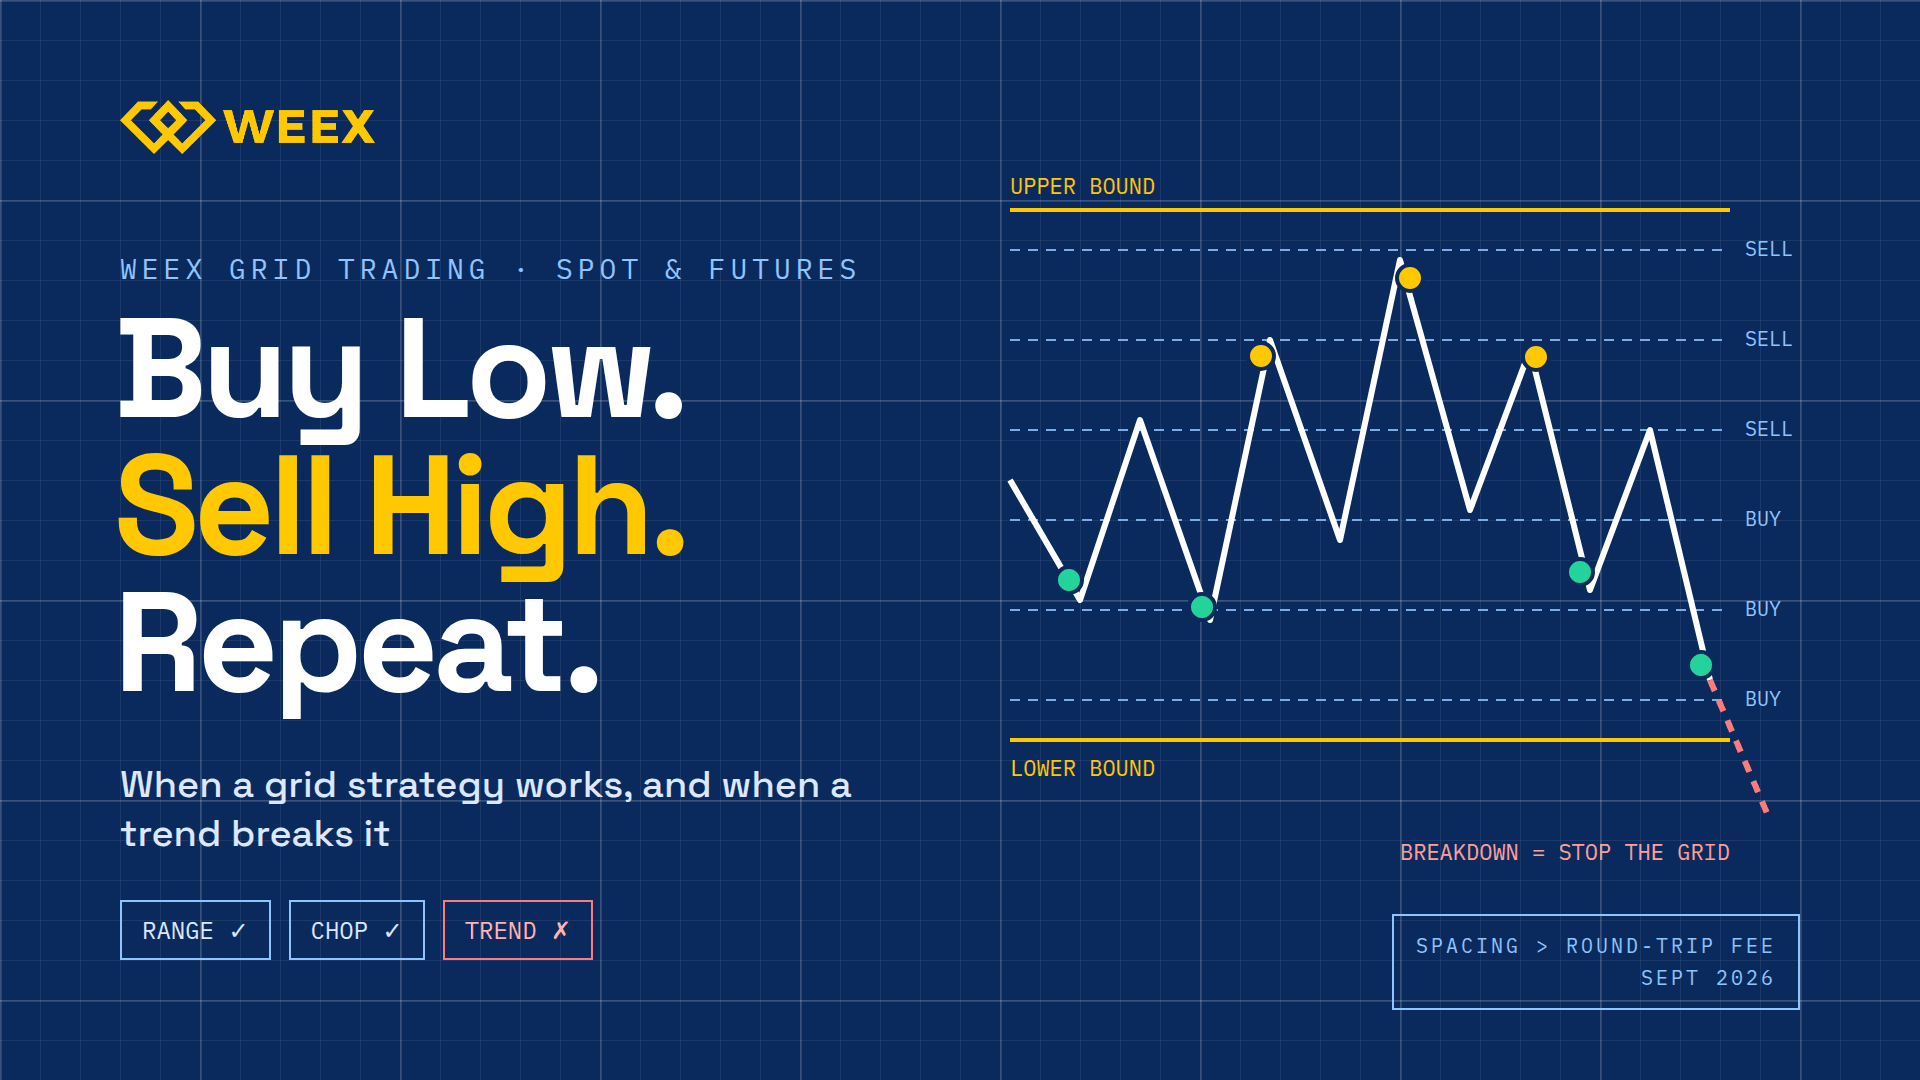
WEEX Grid Trading: When a Grid Strategy Works and When It Fails
WEEX Close Position Guide: Flash Close, Limit Close and TP/SL
WEEX Futures Trading: What 400x Leverage Really Costs You

Best Crypto Exchange for Beginners 2026: What Actually Matters When Choosing One
Bitcoin Short Squeeze Explained: Inside the $648M Sept 21 Wipeout
Best Crypto Cold Wallet 2026: Top Picks Matched to How You Hold
INJ Meridian Upgrade: What Activates Sept 24 and What to Watch
Best Crypto Apps for Beginners: The Five Features That Actually Matter on Your Phone
WEEX Passkey Now Secures Withdrawals: The 4 Actions It Covers
Stock Market Crash Risk in 2026: The Warning Signs Worth Watching
XST Coin Explained: Two Tokens Share One Ticker, Check Which One
SPY Stock in 2026: What the Rebound to Record Highs Is Hiding
What Is Blockchain and How Does It Work? A Transaction Traced




