
Stock Market Crash Risk in 2026: The Warning Signs Worth Watching

 Prefer us on Google


Nobody can reliably predict when a stock market crash will happen, and as of October 2, 2026, US stocks sit close to record highs rather than in freefall. That doesn't make the worry baseless. Under the surface, fewer than half of S&P 500 stocks are in long-term uptrends, and the index already came within a point of a correction earlier this year. This guide defines what actually counts as a crash, compares the biggest ones in history, lays out the signals worth watching in 2026, and explains how crypto tends to behave when stocks break.
What Counts as a Stock Market Crash?
The terms get used loosely, so it helps to pin them down:
- Pullback: a drop of 5% to 10% from a recent high. These happen most years.
- Correction: a decline of 10% to 20%. Uncomfortable, but common.
- Bear market: a fall of 20% or more, usually lasting months.
- Crash: no official threshold — the word describes speed. A double-digit drop over a few days, or a single-session plunge, is what most people mean.
The distinction matters because the response differs. Corrections tend to recover within months. Crashes that turn into long bear markets can take years.
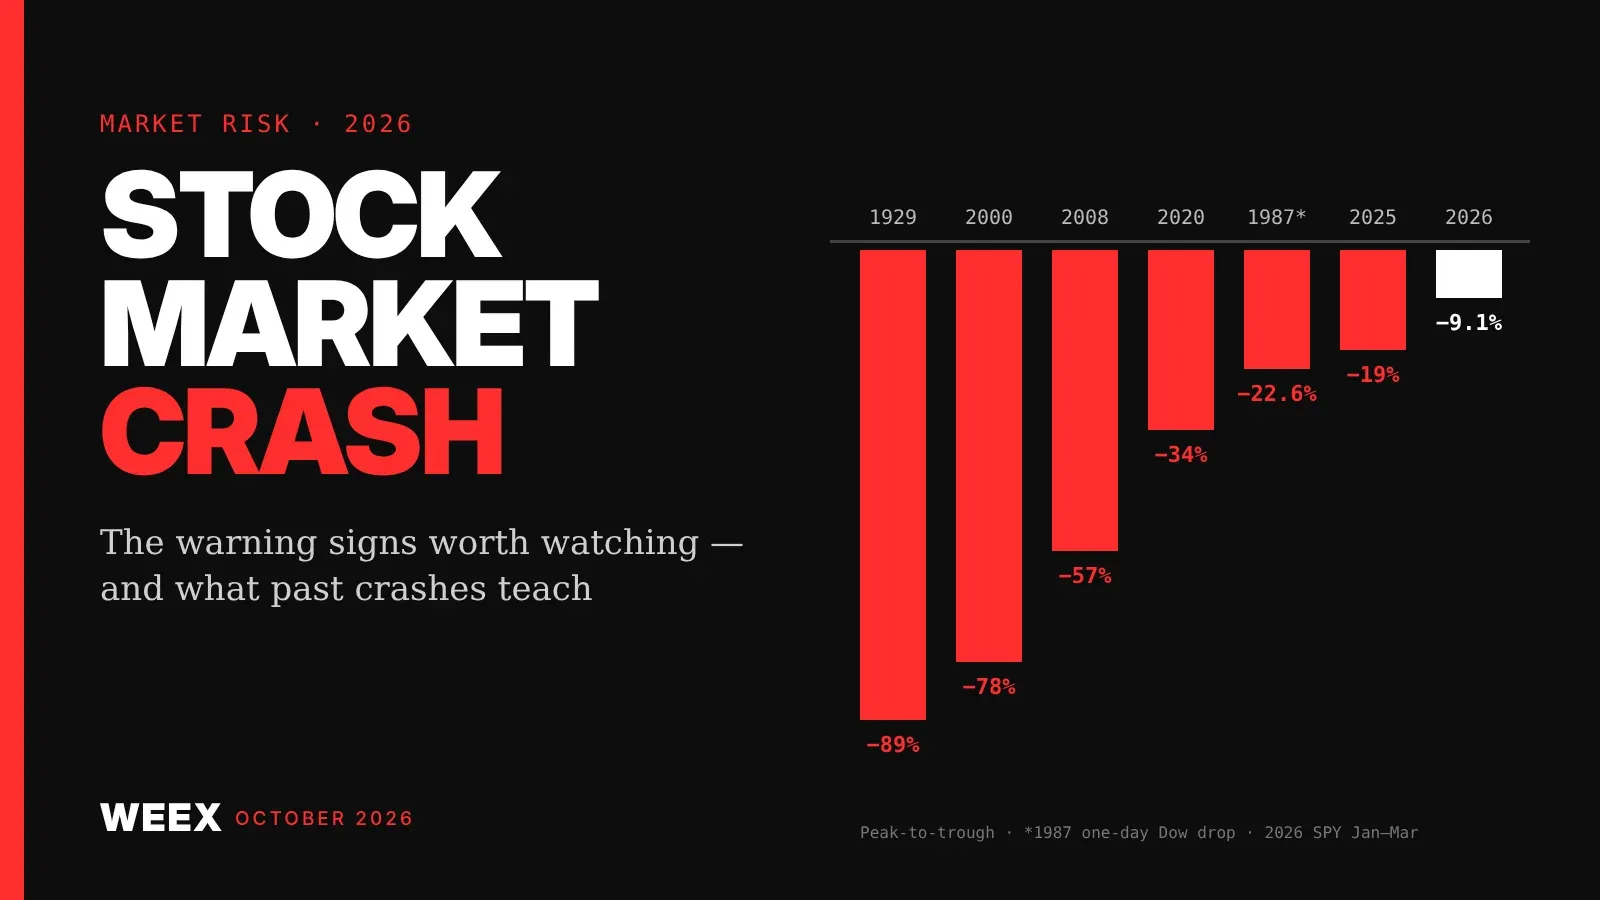
Major Stock Market Crashes, From 1929 to 2026
Measured peak to trough, the big ones look like this:
- 1929–1932: the Dow lost about 89% and needed until 1954 to regain its 1929 high.
- October 19, 1987 (Black Monday): the Dow fell 22.6% in one session, still the largest one-day percentage drop on record. It recovered within about two years.
- 2000–2002 (dot-com bust): the Nasdaq lost roughly 78% as internet valuations collapsed.
- 2007–2009 (global financial crisis): the S&P 500 fell about 57% and didn't make a new high until 2013.
- February–March 2020 (Covid): the S&P 500 dropped about 34% in 23 trading days, then hit new highs by August 2020.
- February–April 2025 (tariff shock): the S&P 500 fell roughly 19% on a closing basis, stopping just short of a bear market, and recovered to records within months.
- January–March 2026: SPY, the largest S&P 500 ETF, slid 9.1% from its January 27 close of $695.49 to $631.97 on March 30 — not even a formal correction.
The pattern worth noticing: fast crashes driven by panic (1987, 2020) have recovered quickly, while crashes rooted in broken valuations or credit (1929, 2000, 2008) took years. The cause matters more than the size of the first drop.
Is a Stock Market Crash Coming in 2026?
The price alone doesn't look stressed. SPY rallied 23.1% from the March low to a record close of $777.88 on August 13, and closed at $763.99 on October 1, about 1.8% below that peak, according to TradingView daily data.
The warning signs sit underneath:
- Narrow breadth. Only 40.55% of S&P 500 stocks traded above their 200-day moving average at the end of September, down from roughly 73% in August, per a Yahoo Finance analysis.
- A rising index with falling stocks. SPY gained 0.26% in September while about 75% of S&P 500 members fell.
- Concentration. Gains leaned on a handful of AI-hardware leaders, while banks and big software names slipped.
The better reading: narrow markets aren't a crash trigger by themselves, and they can persist for a long time. What they do is raise the stakes on a few companies. If the leaders stumble on earnings or AI spending expectations, there's less support underneath to absorb the hit. That's a reason for caution, not a forecast.
Signals that would raise the alarm further:
- Breadth keeps falling while the index holds up.
- SPY loses the March 30 low of $631.97, erasing 2026's rally.
- Credit spreads widen sharply, a sign stress is spreading beyond stocks.
- Leaders sell off on strong earnings — a classic sign that positioning, not fundamentals, is driving price.
-- Price
How Crypto Reacts When Stocks Crash
Crypto is often pitched as a hedge against stock market turmoil. In acute crashes, the record says otherwise.
On March 12, 2020, as stocks plunged, Bitcoin fell roughly 40% in a single day. Leveraged positions were liquidated in waves, and liquidity disappeared across crypto exchanges. The rebound that followed was dramatic, but anyone forced out on the way down didn't benefit from it.
What usually happens in a sharp equity sell-off:
- Correlation rises. Investors sell what they can, and liquid crypto gets sold alongside stocks.
- Leverage amplifies the drop. Crypto markets carry high leverage, so forced liquidations can push prices well past where fundamentals would.
- Recoveries can be faster. When central banks ease, crypto has often rebounded harder than stocks — as it did through 2020.
Practical takeaway: holding crypto doesn't protect a portfolio during the first leg of a stock market crash. Low leverage does. Traders who want to hedge equity exposure directly can use index perpetuals such as the SPY-USDT perpetual or the tech-heavy QQQ-USDT perpetual on WEEX, which trade 24/7 — including on weekends, when cash markets are closed and bad news can still land.
What Investors Usually Get Wrong in a Crash
The losses that hurt most rarely come from the crash itself. They come from decisions made during it:
- Selling after the drop. Many of the market's best days fall right after its worst ones. Missing the rebound locks in the loss.
- Using leverage near highs. A 9% decline like early 2026 is survivable unleveraged. At 10x, it wipes out the position.
- Having no cash buffer. Investors who need money during a downturn are forced to sell at the bottom.
- Mistaking a narrow rally for a broad one. An index at a record can still hide a majority of falling stocks, as September 2026 showed.
A stock market crash can't be scheduled, but its damage can be managed: keep leverage low, know your time horizon, and watch breadth instead of just the headline index. WEEX's BTC-USDT perpetual and index contracts give traders tools to act on a view either way — the discipline around position size is what decides whether a crash is a setback or a wipeout.
FAQ
1. Will the stock market crash in 2026?
No one can say. As of early October 2026, the S&P 500 sits near record highs, but breadth is weak, with only about 40% of its stocks above their 200-day average. That raises risk without signaling timing.
2. What was the worst stock market crash in history?
By total decline, 1929–1932, when the Dow lost about 89%. By single-day drop, Black Monday on October 19, 1987, when the Dow fell 22.6%.
3. How long does it take the market to recover from a crash?
It varies widely. The 2020 crash recovered in about five months. The 2007–2009 crash took until 2013 for the S&P 500 to set a new high, and 1929's Dow peak wasn't regained until 1954.
4. Does Bitcoin go down when the stock market crashes?
Usually in the short term. During the March 2020 crash, Bitcoin fell about 40% in a day as traders sold liquid assets and leveraged positions were liquidated, before rebounding strongly later that year.
This content is provided for general informational purposes only and doesn't constitute financial, investment, legal, or tax advice. Any events, rewards, online promotions, or related information mentioned herein should not be considered a recommendation, solicitation, or invitation to purchase, sell, trade, or otherwise deal in any crypto assets. Crypto assets are highly volatile and may result in loss. The availability of WEEX services, products, and related events may vary by region. You are responsible for ensuring that your participation is in accordance with applicable local laws and regulations.
You may also like

ENA Token Price Up 76% in a Month: The October 5 Unlock Test

How to manage Idle USDT? Top 5 Platforms to Earn Passive Income in 2026 OCT

Taiwan's Travel Rule Starts in October: What Domestic Crypto Transfers Will Require

Germany's Crypto Tax Draft 2027: What the 50 Percent Substitute Assessment Means
Self-Custody Wallets: When a Crypto Transfer Must Be Reported to Brazil's Coaf

Italian Crypto Tax Return 2026: Filing Deadline, Forms and Gains Rate
What Is Aleo (ALEO) Crypto, and Why Did Its Price Jump Up to 88%?

What Is Blockchain Technology? Follow One Transaction to See

What Is Pi Network? A Complete Beginner's Guide

NEAR Price Jumps 80% in a Week: What Confidential Intents Changed

PENGU Airdrop on WEEX: Get 10 USDT in PENGU Before October 6

Why Did the CLARITY Act Fail in the Senate, and What Happens Next for Crypto Regulation?
Airdrops This Week (September 17-23, 2026): Official Conditions and Safety Checks
Senate CLARITY Act Cloture Vote Today: Can Trump's Ethics Compromise Get 60 Votes?

USDC on Arc: What Circle's Mainnet Launch Changes for Holders
Oracle Stock Futures After Earnings: How Leverage Got Liquidated

MU Stock Reclaims $1,000 Again: What's Actually Different This Time

XST Coin Price Fell Over 40% for Two Straight Days: What That Pattern Actually Means
Is The US Becoming The Crypto Capital? Brad Garlinghouse's Bold Predictions Explained
GPT-6 Astra and Crypto: The AI Token Bid and the Cyber Risk
Nike Is Being Removed From the S&P 100: What a 12 Year Low Actually Means for the Stock
Lululemon Stock Crashes to an 8 Year Low Right Before Its New CEO Even Starts
PONS Robinhood Chain Token: What the Buyback Rally Rests On

Dell Stock Surges 9.4% After Smashing Earnings Estimates: What Drove the AI Server Beat

SQQQ Explained: Why the 3x Inverse Nasdaq ETF Bleeds Value

How Safe Are the Crypto Exchanges Pakistani Traders Actually Use? A Security Comparison
XST Coin Price Crosses Into Deep Capitulation Territory: What a 90%+ Decline Actually Signals
Crypto Futures Liquidation in Pakistan: How It Works and How to Manage Risk
XPL/USDT After the August 25 Unlock: Will Ecosystem Incentives Create Demand or Selling Pressure?
SPCX Stock Keeps Swinging Around Its $135 IPO Price : What the Lockup Schedule Still Ahead Actually Means
ENA Token Price Up 76% in a Month: The October 5 Unlock Test
How to manage Idle USDT? Top 5 Platforms to Earn Passive Income in 2026 OCT
Taiwan's Travel Rule Starts in October: What Domestic Crypto Transfers Will Require
Germany's Crypto Tax Draft 2027: What the 50 Percent Substitute Assessment Means
Self-Custody Wallets: When a Crypto Transfer Must Be Reported to Brazil's Coaf
Italian Crypto Tax Return 2026: Filing Deadline, Forms and Gains Rate
Contents
Popular coins
Latest articles





