Can Crypto Quantitative Trading Make Money? Risks and Reality

 Prefer us on Google
Crypto quantitative trading can make money, but automation itself does not create profits. A program simply reads market data and executes predefined rules. The real question is whether the strategy still has a positive expected return after fees, slippage, and execution errors are included.
This leads to the central point of this article: do not judge a quantitative strategy only by how much it earned. Look at the drawdown required to achieve that return and whether the advantage survives real trading costs.
How Does Crypto Quantitative Trading Make Money?
Quantitative strategies try to capture repeatable market behavior. Trend-following systems trade sustained price movements, while mean-reversion models assume that prices may return toward an average after moving too far. Grid bots attempt to profit from repeated fluctuations within a defined range.
| Strategy | Source of potential return | When it may fail |
|---|---|---|
| Trend following | Follows sustained price direction | Sideways, unstable markets |
| Mean reversion | Trades a possible return toward an average | Long-lasting trends |
| Grid trading | Buys and sells repeatedly within a range | Price falls below the range |
| Momentum | Follows price and volume strength | Signal arrives too late |
| Arbitrage | Uses temporary price differences | Fees and delays remove the spread |
These strategies do not become profitable simply because a bot executes them. Automation improves consistency and speed, but the strategy still needs a genuine statistical or market-based advantage.
A High Win Rate Does Not Guarantee Profit
Many users evaluate a trading bot by its win rate. However, win rate only shows the percentage of profitable trades. It does not show how much the strategy wins or loses on each trade. Consider two simplified examples.
Strategy A wins 70% of its trades. Each winning trade earns 10 USDT, but each losing trade costs 40 USDT. Over 100 trades, it earns 700 USDT from 70 winners and loses 1,200 USDT from 30 losers. The final result is a 500 USDT loss before fees.
Strategy B wins only 40% of its trades. Each winner earns 50 USDT, while each loser costs 20 USDT. Over 100 trades, it earns 2,000 USDT and loses 1,200 USDT, leaving an 800 USDT profit before costs.
This is why strategy evaluation should combine several measures.
| Metric | What it tells you |
|---|---|
| Total return | The final result during the test |
| Maximum drawdown | The largest fall from a previous account peak |
| Win rate | The percentage of profitable trades |
| Profit-to-loss ratio | Whether average gains cover average losses |
| Number of trades | Whether the sample is large enough |
| Return consistency | Whether profits depend on only a few trades |
If most of a strategy’s profit comes from one or two unusual market events, its long-term reliability may be limited.
Why Can a Profitable Backtest Lose Money Live?
Backtesting applies trading rules to historical data. It is useful, but live markets contain costs and operational problems that simplified tests may miss.
Overfitting Historical Data
A developer may repeatedly adjust moving-average periods, stop-loss levels, and entry conditions until the historical curve looks almost perfect. Those parameters may only fit one specific period.
For example, a trend strategy optimized during a strong bull market may produce repeated false signals when Bitcoin begins moving sideways. An unusually smooth backtest should therefore be checked for overfitting.
Fees Can Remove a Small Trading Edge
Short-term strategies often depend on many small profits, making them highly sensitive to fees.
Using WEEX as a cost example, the currently provided standard fee information lists a 0.02% maker fee and a 0.08% taker fee. The latest rate should still be confirmed on the WEEX fee schedule.
Suppose a bot uses market orders to buy and later sell a 10,000 USDT position. At a 0.08% taker rate on both sides, the basic round-trip trading fee would be about 16 USDT, excluding slippage and possible funding costs.
If the strategy expects to earn only 10 USDT per trade, a profitable signal on paper may become a loss after fees.
Slippage Changes the Execution Price
Slippage is the difference between the expected order price and the actual fill price. It may increase during rapid market moves, on less liquid pairs, or when the order is large relative to available liquidity.
A backtest may assume that every order fills at the candle’s closing price. In live trading, the market may move before the order arrives. Even small slippage can remove the advantage of a strategy with narrow profit targets.
Technical Problems Affect Live Results
Network interruptions, delayed data, rejected orders, partial fills, and API timeouts can all create differences between backtested and live performance.
For example, a program may submit an order but fail to receive the response. If it immediately sends the same instruction again without checking the first order, it may accidentally create excess exposure. A reliable system therefore needs order-status checks, logs, alerts, and error-handling rules.
Why Maximum Drawdown Matters
Maximum drawdown measures the largest decline from an account peak to a later low.
Imagine that two strategies both earn 20% in one year. Strategy A experiences an 8% maximum drawdown, while Strategy B falls 45% before recovering. Their final returns are the same, but their risk profiles are very different.
Large losses are also harder to recover from. After losing 20%, an account needs to gain 25% to return to its starting value. After losing 50%, it needs a 100% gain.
Before focusing on expected profit, users should ask whether they could financially and emotionally tolerate the strategy’s potential drawdown.
How to Test a Strategy More Realistically
A more reliable process includes historical backtesting, out-of-sample testing, simulated trading, and limited live trading.
Backtests should include fees, estimated slippage, position limits, and minimum order requirements. Out-of-sample testing should use data that was not involved in selecting or adjusting the strategy parameters.
During limited live testing, compare the following:
| Backtest vs. live result | What to check |
|---|---|
| Expected and actual prices | Whether slippage is higher than planned |
| Expected and actual trades | Whether orders are missed or duplicated |
| Estimated and actual costs | Fees and funding expenses |
| Strategy and account positions | Partial fills or synchronization errors |
| Expected and actual drawdown | Whether live risk is significantly higher |
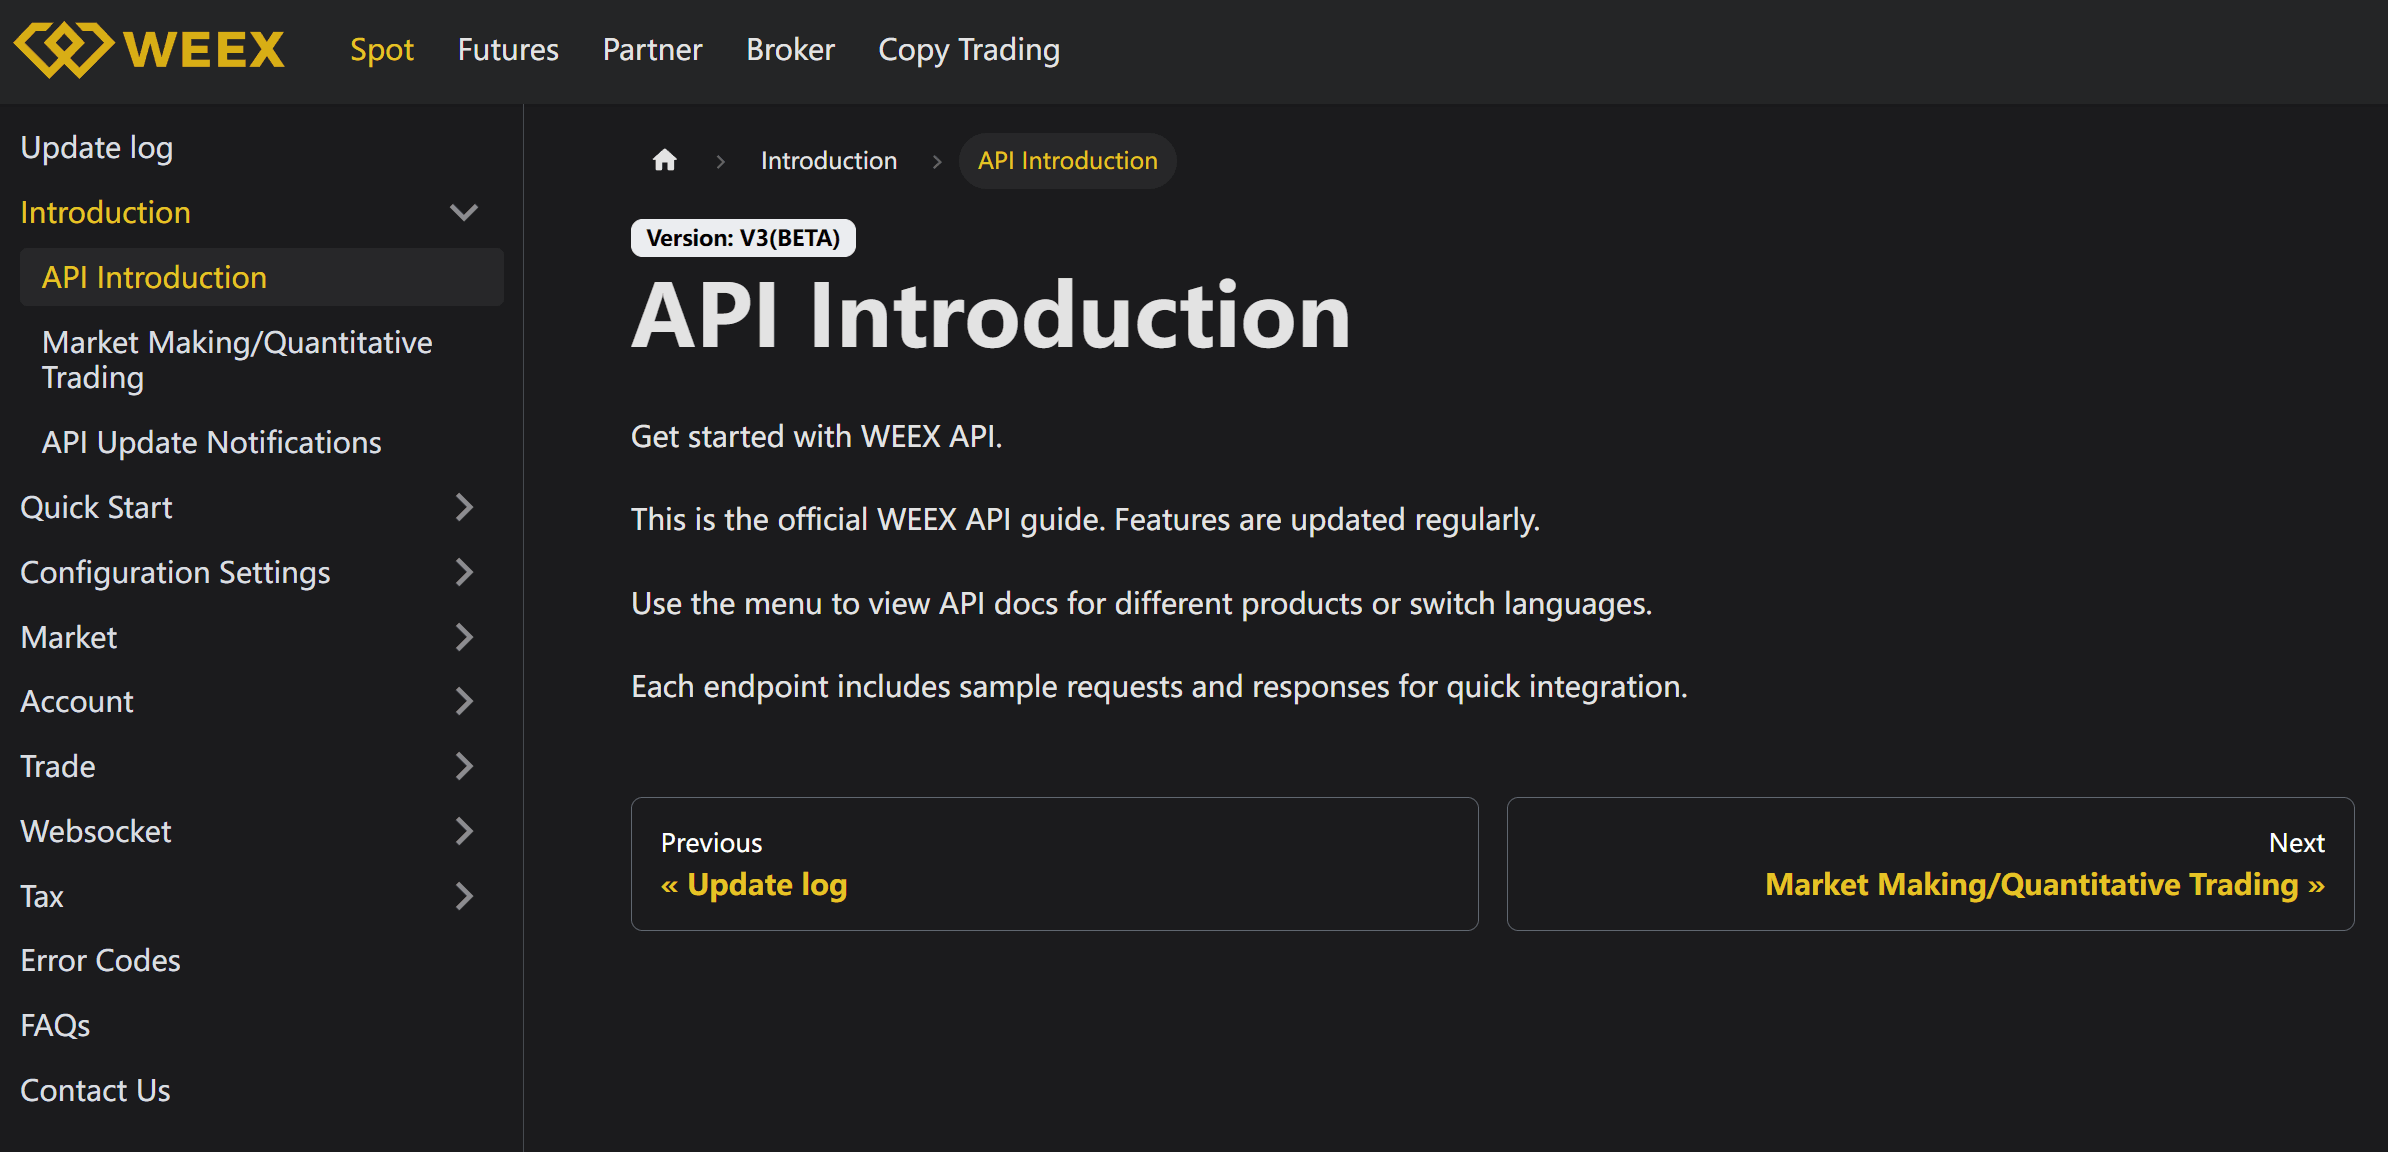
Developers can use the WEEX API page to review market data, candlesticks, order books, REST API, and WebSocket resources. A common integration process is to read the documentation, create an API Key, connect the required endpoints, and test order and error handling.
WEEX is one possible execution venue. Its API can transmit market data and orders, but it cannot determine whether a strategy has a profitable edge. Developers should use current symbol formats such as BTCUSDT, avoid reusing the same newClientOrderId across separate orders, and enable only the API permissions they need.
Warning Signs of Exaggerated Bot Returns
Real strategies usually experience losing trades and drawdowns. Claims of fixed returns, guaranteed profits, or performance that never changes with market conditions should be treated carefully.
Other warning signs include incomplete screenshots instead of full trading records, no disclosure of fees or drawdown, very short test periods, requests for account passwords or withdrawal access, and strategies that cannot explain when they are likely to lose.
A transparent system should clearly describe its entry, exit, position-sizing, and shutdown rules. It should also show losing periods rather than only its best results.
Conclusion
Crypto quantitative trading can make money, but profits come from a strategy that retains a positive expected return after real costs—not from the bot itself.
A useful evaluation should consider total return, maximum drawdown, win rate, profit-to-loss ratio, fees, slippage, sample size, and performance across different market conditions. A high win rate can still lose money, while an attractive backtest may fail during live execution.
Exchange APIs can improve data access and order execution, but they cannot replace strategy research, risk control, or system monitoring. Beginners should start with understandable rules, test them under realistic conditions, and use only limited capital during early live trading.
This content is provided for general informational purposes only and doesn't constitute financial, investment, legal, or tax advice. Any events, rewards, online promotions, or related information mentioned herein should not be considered a recommendation, solicitation, or invitation to purchase, sell, trade, or otherwise deal in any crypto assets. Crypto assets are highly volatile and may result in loss. The availability of WEEX services, products, and related events may vary by region. You are responsible for ensuring that your participation is in accordance with applicable local laws and regulations.
You may also like

What Is PGP Encryption? A Beginner's Guide
Lost Your 2FA Device? Here's What to Do Next

What Is a Crypto Broker API? How Platforms Embed Trading Without Building an Exchange
What Is WEEX Broker? How the Program Works and Who It Is For

Nvidia Stock Price Has 46% Upside According to Wall Street: What the $308 Average Target Actually Requires
Is 2FA Enough to Keep Your Crypto Safe?
Is AMD Stock a Buy After Falling 9% on Record Earnings? What the Setup Actually Looks Like

PLTR Stock Price Prediction 2026-2027: Can Palantir Reach $200 After the Q2 Blowout?

Samsung Stock Price Prediction 2026-2027: Can Samsung Reach $250 After the July Selloff?

How to Set Up 2FA on Your Crypto Exchange Account
KOSPI Price Prediction 2026-2027: Can the Index Recover to 7,000 After Its Worst Month Since 2008?
SK Hynix Stock Is Down 35% in July: Is the Worst Finally Over?
SK Hynix Stock Price Targets Range From $152 to $355: What the Widest Analyst Gap in the Sector Reveals
SpaceX Stock Price Prediction 2026-2027: Can SPCX Reach $200 After the First Earnings Beat?
SPCX Stock Price Q2 Earnings Revealed: What Starlink Revenue and the $14 Billion AI Contract Surge Actually Mean
Caterpillar Stock After a Record Quarter: CAT vs the CATON Token
Zeta Stock Just Beat and Raised for the 20th Time and Fell 7%
SPCX Stock Price and the $116 Billion Lockup Expiry Tomorrow: What Actually Happens on August 6
NET Stock Trades Above Wall Street's Target Into Aug 6 Earnings
API Trading Software: Check the Exchange Limits First

AMD Earnings: Why a Record Q2 Beat Still Sank the Stock 9%
AMD Stock Falls 9% After Data Center Revenue Doubles: What the Disconnect Means
Rupiah Weakness and Crypto Demand in 2026: What the Evidence Does — and Doesn't — Show

Crypto Futures Explained for Beginners: Margin, Leverage, Funding and Liquidation
Tokenized Gold in 2026: XAU, XAUT and PAXG Explained — Backing, Custody and Fees
What Is Cysic (CYS)? ComputeFi, ZK Hardware, and AI Explained
Cysic (CYS) Coin Price Forecast 2026: AI Growth vs Token Supply Risk
What Is Futures Quantitative Trading? Strategies and Risks
Bitcoin Quantitative Trading Guide: Strategies, Tools, and Risks
AMD vs Nvidia After Q2 Earnings: Which Stock Is the Better Buy?
What Is PGP Encryption? A Beginner's Guide
Lost Your 2FA Device? Here's What to Do Next
What Is a Crypto Broker API? How Platforms Embed Trading Without Building an Exchange
What Is WEEX Broker? How the Program Works and Who It Is For
Nvidia Stock Price Has 46% Upside According to Wall Street: What the $308 Average Target Actually Requires
Is 2FA Enough to Keep Your Crypto Safe?
Contents
Popular coins
Latest articles