
Altcoin Season? Why 63% Beat Bitcoin (BTC) While WEEX Median Returns Stayed Flat

 Prefer us on Google


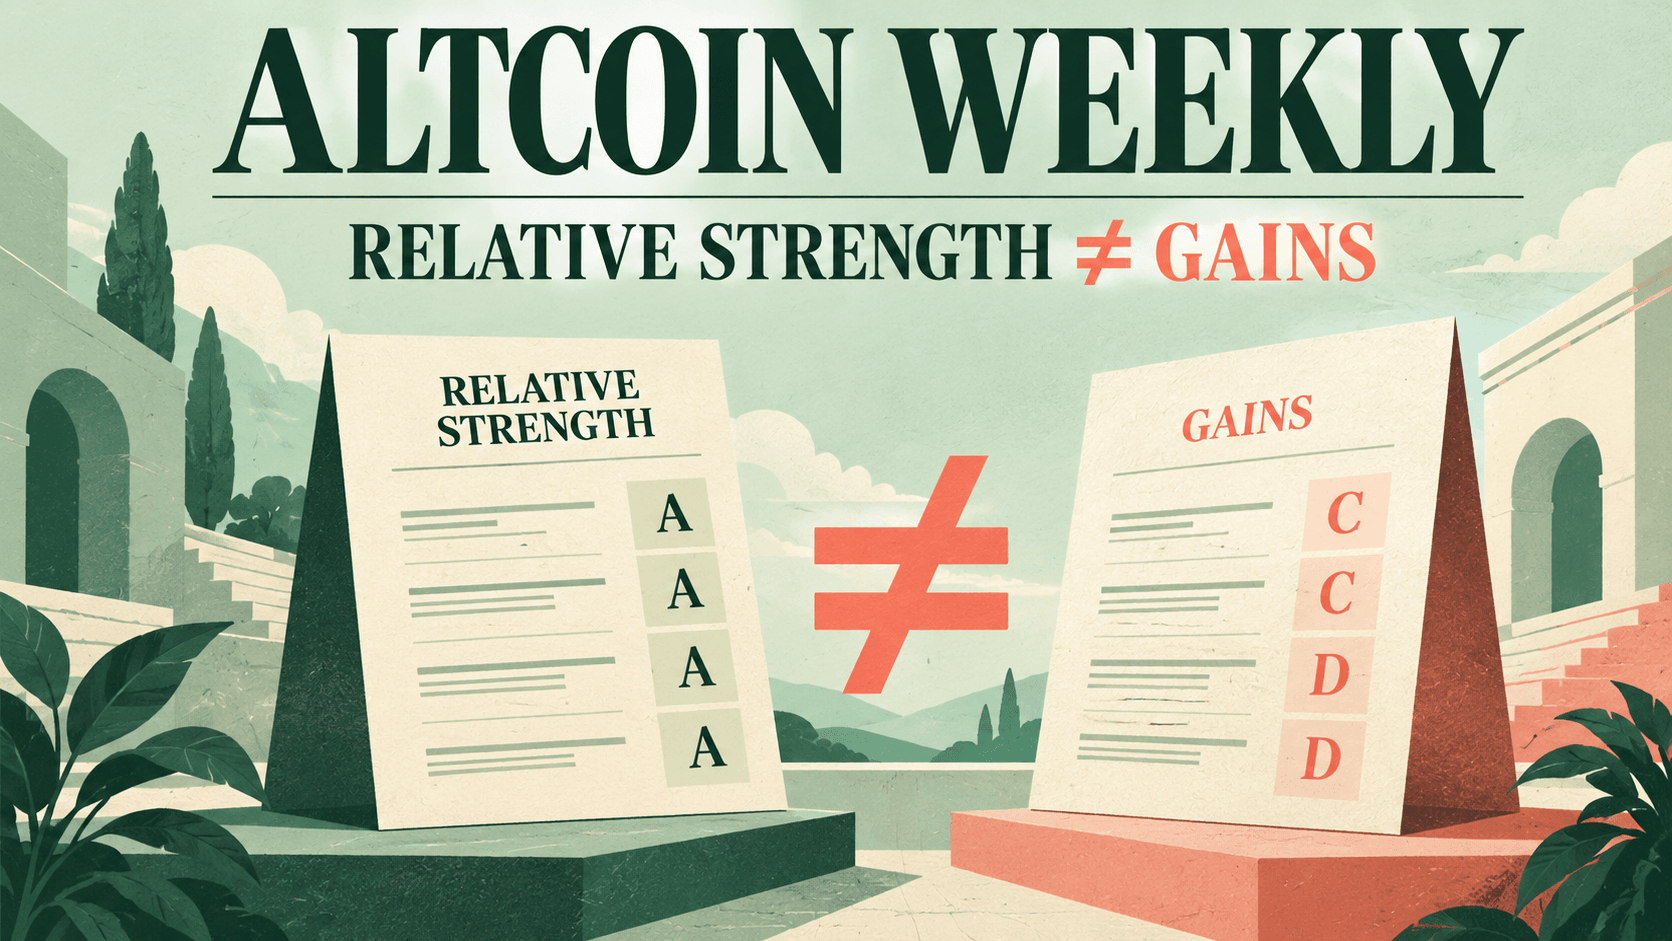
WEEX’s October 16 dashboard reported that 63% of its monitored altcoins outperformed Bitcoin (BTC) over seven days, while the median altcoin return was displayed at 0% and Bitcoin’s return at −1%. The combination points to relative resilience within the platform sample, rather than proof of a broad rally. When the benchmark declines, an asset can outperform it while still losing value.
Our editorial view is that “63% beat Bitcoin” is a useful finding but an insufficient altcoin-season headline. The flat median is the essential qualification: the typical observation was around unchanged at the dashboard’s displayed precision. The stronger story is that many sampled altcoins held up better than Bitcoin, while the evidence for widespread positive returns remains incomplete.
For readers using Bitcoin as the comparison benchmark, WEEX provides a Bitcoin perpetual-futures reference page and a Bitcoin spot market page. The distinction matters when moving from analysis to execution: a derivative position and an unleveraged spot holding carry different mechanics, and neither should be selected merely because another asset recently outperformed the benchmark.
What Does WEEX’s Altcoin Dashboard Actually Show?
The dashboard contains three aggregate observations and two lists of ranked symbols. Taken together, they describe the distribution of relative performance more usefully than a list of isolated winners.
| Seven-Day Dashboard Measure | Displayed Result |
|---|---|
| Bitcoin return | −1% |
| Median altcoin return | 0% |
| Share of monitored altcoins outperforming Bitcoin | 63% |
| Top-five symbols, in displayed order | AIB, PUFFER, HNO, SHARE, ZZZ |
| Bottom-five symbols, in displayed order | US, EDGEN, RSS3, LONGARC, APR |
Source: WEEX dashboard supplied with the October 16, 2026 export. Returns retain the dashboard’s displayed rounding.
The median and outperformance share answer different questions. The median identifies the middle return in the sample. The outperformance share measures how many observations exceeded Bitcoin’s return.
A zero median and a 63% outperformance share can coexist without contradiction. If Bitcoin falls, assets that remain flat—or decline by less—can count as outperformers.
The sample size and eligibility rules were not supplied. Consequently, the 63% figure is retained as a reported platform statistic, not converted into an exact number of assets or extrapolated to the entire crypto market.
Why Beating Bitcoin (BTC) Does Not Necessarily Mean Making Money
Relative return measures performance against a benchmark. Absolute return measures whether an asset increased or decreased in value over the selected window.
The difference becomes particularly important when the benchmark is negative.
| Illustrative Asset Return | Bitcoin Benchmark | Difference | Interpretation |
|---|---|---|---|
| +2.0% | −1.0% | +3.0 percentage points | Positive return and outperformance |
| 0.0% | −1.0% | +1.0 percentage point | Flat return and outperformance |
| −0.5% | −1.0% | +0.5 percentage points | Negative return, but still outperformance |
| −2.0% | −1.0% | −1.0 percentage point | Negative return and underperformance |
These scenarios explain the calculation; they are not additional observations from the WEEX dataset.
This distinction changes how the weekly result should be described. The dashboard supports saying that a majority of monitored altcoins performed better than Bitcoin. It does not support saying that 63% rose.
Nor does it reveal the size of the gains among outperformers. A narrow advantage over a declining benchmark and a strong independent advance both qualify as outperformance, but they have very different implications for traders.
Does the 63% Reading Signal Altcoin Season?
The available evidence is insufficient to declare altcoin season.
Such a conclusion would require a clearly defined universe, a consistent measurement window, and evidence that relative strength is broad and persistent. This dashboard provides one trailing seven-day observation, with no comparable historical readings in the supplied material.
The median return also remains flat at the displayed precision. That weakens the argument that the sample is experiencing a strong, broadly positive advance.
There is no BTC dominance series in the supplied dashboard. The proportion of tokens beating Bitcoin is not the same as Bitcoin’s share of total crypto market capitalization. One measures cross-sectional returns; the other measures the composition of aggregate market value.
The more accurate classification is therefore “short-term relative resilience in the WEEX sample.” It is less dramatic than an altcoin-season declaration, but it reflects what the data actually establishes.
-- Price
What Can the Top-Five and Bottom-Five Lists Tell Us?
The ranked lists identify where further investigation should begin. They do not supply enough information to finish the analysis.
AIB, PUFFER, HNO, SHARE, and ZZZ appear in the displayed top-five list. US, EDGEN, RSS3, LONGARC, and APR appear in the bottom-five list. These identifiers are reproduced exactly as supplied, without assigning unverified project names or contract identities.
Crucially, the dashboard does not attach numerical returns to those symbols. A top-ranked asset might have posted a substantial gain, a small gain, or merely the smallest decline in a weak sample. Its position alone cannot resolve that question.
The same applies to the bottom list. Ranking last is not equivalent to experiencing an exceptional crash. Without the percentage moves, the gap between the strongest and weakest assets cannot be calculated.
For this reason, the lists are watchlists for investigation rather than recommendations. Before any asset-specific article or trading conclusion, the exact instrument, return, listing history, and trading conditions would need to be verified.
Why a Ranked List Is Not a Performance Distribution
A leaderboard highlights the tails of a sample. It says little about what happens between those tails.
A market can have several spectacular winners while most assets fall. It can also have few dramatic winners while a broad majority records modest gains. Both situations can generate appealing headlines, but they describe different trading environments.
The supplied median provides a valuable corrective. At a displayed 0%, it prevents the most eye-catching symbols from defining the entire weekly narrative.
However, rounding limits the precision of that conclusion. A displayed median of 0% does not establish that the underlying unrounded median was exactly zero. It could conceal a small positive or negative value. The appropriate language is “around flat at displayed precision.”
An expanded distribution would make the next report stronger: the positive-return share, lower and upper quartiles, and numerical leader-laggard spread would show whether the sample is broadly improving or merely becoming more dispersed.

What Would Confirm Broader Altcoin Strength?
The next observation should test three separate forms of improvement: absolute performance, relative performance, and persistence.
A positive median would show that the middle observation had moved above its starting value. A high outperformance share would show that strength extended beyond a minority of assets relative to Bitcoin. Repeated readings under an unchanged methodology would show whether the result persisted.
| Next-Period Result | More Defensible Interpretation |
|---|---|
| Median turns positive; outperformance remains broad | Stronger evidence of broad participation |
| Median stays flat; Bitcoin remains negative | Continued relative resilience |
| A few leaders surge; median weakens | Narrow leadership rather than broad improvement |
| Bitcoin rises; altcoin outperformance falls | Benchmark strength is not being matched across the sample |
These are conditional interpretations, not forecasts. They make the next weekly comparison testable without inventing a proprietary score.
The sample must also remain comparable. New listings, delistings, duplicate instruments, stablecoins, or missing observations can change aggregate results even when the underlying market behavior has not changed in the same way.
Because the current universe rules were not supplied, this first edition should serve as a documented starting observation rather than the beginning of an assumed historical trend.
What This Means for Traders
The practical lesson is to separate the decision to investigate from the decision to trade.
The 63% figure justifies looking beyond Bitcoin for assets showing relative resilience. It does not identify which of those assets offers a favorable entry, sufficient market depth, or acceptable downside risk.
Likewise, a top-five appearance does not show whether a move is supported by sustained activity. The dashboard contains no volume, order-book depth, unlock schedule, funding, or open-interest series for those assets. It therefore cannot establish whether the leaders are liquid, crowded, newly listed, or facing near-term supply events.
A useful market review should preserve these distinctions. A short-lived leaderboard position can be newsworthy without becoming an investment thesis.
FAQ
1. Did 63% of WEEX Altcoins Rise?
Not necessarily. The dashboard says 63% outperformed Bitcoin, which was displayed down 1%. Some outperformers could still have had negative returns.
2. Why Was the Median Altcoin Return Flat?
The middle return was displayed at 0%. The unrounded value and the full return distribution were not supplied, so the result should be described as approximately flat.
3. Does This Confirm Altcoin Season?
No. A single seven-day platform observation, without a defined sample size or historical series, is insufficient to establish a persistent market-wide rotation.
4. Are the Top-Five Symbols Buy Recommendations?
No. They are identifiers in the supplied leaderboard. Numerical returns and other necessary instrument-level information were not provided.
5. Is the Outperformance Share the Same as BTC Dominance?
No. The outperformance share compares asset returns with Bitcoin. BTC dominance measures Bitcoin’s share of aggregate crypto market capitalization.
WEEX Editorial View: Relative Resilience Comes Before a Rally Claim
The most useful result is the combination, not the headline number alone. A 63% outperformance share alongside a flat median and a negative Bitcoin benchmark suggests that many monitored assets held up relatively well.
That is a legitimate observation worth tracking. It is not yet a broad-rally verdict. The next meaningful confirmation would be a positive median, continued relative strength, and a comparable sample across subsequent reports. Until then, “better than Bitcoin” should retain its precise meaning.
Sources and Methodology
Primary source: WEEX internal “BTC and Altcoin Rotation” dashboard supplied with the October 16, 2026 materials. The source did not provide an exact measurement timestamp, timezone, sample count, or detailed eligibility rules.
Benchmark reference: WEEX Bitcoin market pages, checked October 16, 2026. All reported performance figures come from the supplied dashboard; no CMC, CoinGlass, or other exchange dataset was substituted. Illustrative scenarios are explicitly labeled and are not measured returns.
This content is provided for general informational purposes only and doesn't constitute financial, investment, legal, or tax advice. Any events, rewards, online promotions, or related information mentioned herein should not be considered a recommendation, solicitation, or invitation to purchase, sell, trade, or otherwise deal in any crypto assets. Crypto assets are highly volatile and may result in loss. The availability of WEEX services, products, and related events may vary by region. You are responsible for ensuring that your participation is in accordance with applicable local laws and regulations.
You may also like
Is a Bitcoin record closer than you think? This one indicator reveals everything

WEEX TradFi Weekly Review: Semiconductor Contracts Lag While Apple and Coinbase Rise
WEEX TradFi weekly review: chip contracts lag SPY as Apple and Coinbase rise. Compare returns, buying activity, and leveraged ETF product risks.

Bitcoin (BTC) Weekly Outlook: Price Slips as WEEX Spot and Futures Buying Readings Diverge
Bitcoin weekly outlook from WEEX data: compare completed and partial weeks, spot versus futures buying readings, and the limits of trader positioning.

$5 Billion Bitcoin Seized: Should the Gains Belong to Victims or the UK Government?

US Becomes Bitcoin Importer in 2026

Native Bitcoin collateral on Aave triggers WBTC pool deficit

ANAP Reports Bitcoin Valuation Loss of 4.37 Billion Yen, Reversing Previous Period's Valuation Gain of 1.2 Billion Yen

Cryptocurrency Market Grows by $840 Billion, but Spot Trading Drops by 14.2%

Bitcoin: Google Takes a Step Towards Reliable Quantum Computers

大冰要抄底(专注交易) Shares Short Selling Strategy on Nasdaq
Budget 2027: Where do the crypto amendments stand in the assembly?

Bitcoin ETFs See $5.06 Million Net Inflow as Bearish Expectations Rise

UniSat Partners with Utexo to Integrate USDT into Bitcoin Ecosystem

Ledger Scams: A Fraudster Loses 60 Bitcoins

Arthur Hayes says altcoin profits fund Bitcoin purchases

唐华斑竹 Discusses zkEVM Security-First Strategy

Long-term Bitcoin holders send 480 BTC per hour to exchanges during sell-off

South Korean investors shift to offshore crypto futures ahead of tax implementation

BTC Staking Reaches 735 Coins, STX Staking Increases Over 25%

Analyzing Opportunities and Risks Behind 30% Annualized Fixed Income of Pendle's New Arbitrage Product

Strive SATS Preferred Stock IPO Increased to 7 Million Shares, Expected to Raise $630 Million

唐华斑竹 Analyzes Market Rebound and Sector Divergence
Stocks and Crypto Rebound After Hot PPI | WEEX TradFi Daily Brief (October 16, 2026)
On October 15, September PPI rose 6.3% year on year, the highest in more than four years, briefly lifting hike expectations and triggering a short drop in equities and crypto. After the market digested the print, risk assets rebounded from the sell-off and the three major indexes closed higher. Bitcoin briefly broke below $80,000 and recovered to the $82,000–$83,000 range. CoreWeave fell sharply on bond pressure and then closed higher, while crypto-finance stocks and some L2 tokens strengthened. October 16 focus turns to industrial production and import-export prices.

WEEX Exclusive:Stocks and Crypto Rebound After Hot PPI | WEEX TradFi Daily Brief (October 16, 2026)

Justin Sun Warns of Quantum Threat, Market Underestimates Q-Day's Impact on Bitcoin

Colin Wu: Crypto Market Enters Prolonged Stagnation Phase

Google quantum computing advance not capable of breaking Bitcoin keys

Lightning Labs launches LayerTree BTC scaling technology

U.S. court rejects Gemini-CFTC request to void $5M settlement
Bitwise Predicts AI Crisis Will Boost Bitcoin
Is a Bitcoin record closer than you think? This one indicator reveals everything
WEEX TradFi Weekly Review: Semiconductor Contracts Lag While Apple and Coinbase Rise
WEEX TradFi weekly review: chip contracts lag SPY as Apple and Coinbase rise. Compare returns, buying activity, and leveraged ETF product risks.
Bitcoin (BTC) Weekly Outlook: Price Slips as WEEX Spot and Futures Buying Readings Diverge
Bitcoin weekly outlook from WEEX data: compare completed and partial weeks, spot versus futures buying readings, and the limits of trader positioning.
$5 Billion Bitcoin Seized: Should the Gains Belong to Victims or the UK Government?
US Becomes Bitcoin Importer in 2026
Native Bitcoin collateral on Aave triggers WBTC pool deficit
Contents
Latest articles


Latest coin listings on WEEX


