- Buy Crypto
- Markets
 Futures
- Spot
- Copy Trade
 Earn
Earn- More
On-Chain Data School (Part Four): Visualizing BTC UTXO Age Price Distribution Chart
Original Article Title: "On-chain Data Classroom (Part 4): Visualizing the $BTC Chip Price Distribution Chart "
Original Article Author: Mr. Berg, On-chain Data Analyst
This article is the 4th in the On-chain Data Classroom series, which consists of 10 articles in total. Take you step by step to understand on-chain data analysis. Interested readers are welcome to follow this series of articles.
Related Reading: "On-chain Data Classroom (Part 3): Have the Bottom Fishing Whales Taken Profit?"
TLDR
- This article will introduce the on-chain metric URPD
- URPD shows the distribution of $BTC chips at different holding costs
- URPD can be used to observe chip turnover, distribution conditions, and provide guidance on trends
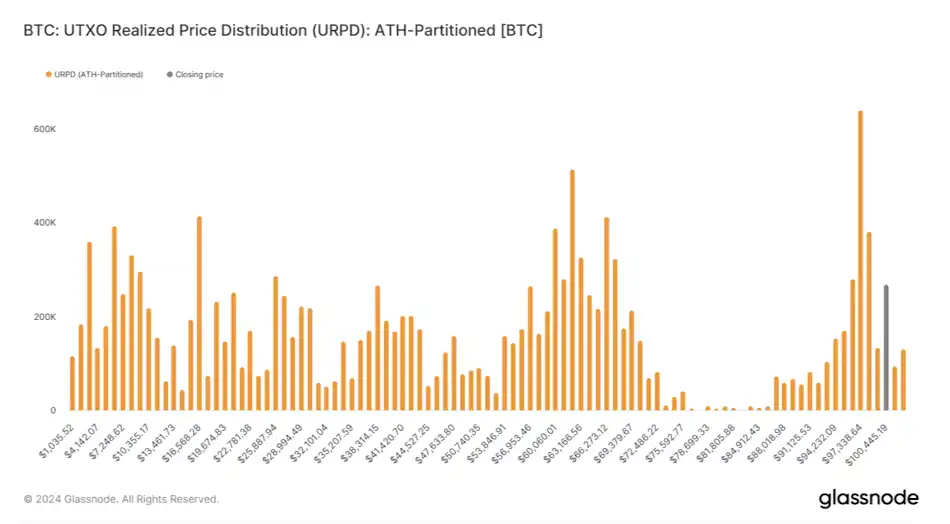
What is URPD?
URPD, short for UTXO Realized Price Distribution.
Due to BTC's unique UTXO blockchain structure,
we can track data on-chain that is unavailable in traditional financial markets.
The URPD chart is an indicator derived from this principle,
where we can see the number of chips corresponding to each price level on the chart,
equivalent to showing the "buying cost of each $BTC."
URPD, Chip Turnover, Accumulation, and Distribution
After understanding the concept of URPD,
we can then observe the turnover of chips at different price levels based on the daily URPD changes.
For example:
Chart one below is the URPD chart for May 1,
while chart two is the URPD chart for October 1.
After experiencing five months of wide-ranging fluctuations in price,
It is quite obvious to see the phenomenon of low-cost chips being distributed upwards.

URPD, Chip Turnover, Accumulation, and Distribution (2)
In history, at a market top, it is usually accompanied by the tail end of high-profit low-cost chip distribution;
while at a market bottom, a large amount of chips can be seen accumulating in a relatively narrow range.
Therefore, in analysis,
URPD is often observed together with other data (such as realized profit, MVRV, etc.),
integrating logical thinking to understand the market from a more comprehensive perspective.

Support, Resistance, Consensus
When a significant amount of chips begins to accumulate in a single price range,
it indicates that a supply-demand consensus has gradually formed in that range.
Once the price later rapidly rises out of that range,
due to the high turnover of chips in that range,
it is likely to provide support in the future;
Conversely, if the price falls below that range,
the chips in that range will become trapped chips,
which may act as resistance levels in future price increases.
Conclusion
The above is all the content of On-Chain Data School (Part Four). For readers interested in delving deeper into on-chain data analysis, remember to keep track of this series of articles!
If you want to see more analysis and educational content on on-chain data, feel free to follow my Twitter handle (X)!
Hope this article has been helpful to you. Thank you for reading.
You may also like

$15K+ Profits: The 4 AI Trading Secrets WEEX Hackathon Prelim Winners Used to Dominate Volatile Crypto Markets
How WEEX Hackathon's top AI trading strategies made $15K+ in crypto markets: 4 proven rules for ETH/BTC trading, market structure analysis, and risk management in volatile conditions.

A nearly 20% one-day plunge, how long has it been since you last saw a $60,000 Bitcoin?

Raoul Pal: I've seen every single panic, and they are never the end.

Key Market Information Discrepancy on February 6th - A Must-Read! | Alpha Morning Report

2026 Crypto Industry's First Snowfall

The Harsh Reality Behind the $26 Billion Crypto Liquidation: Liquidity Is Killing the Market

Why Is Gold, US Stocks, Bitcoin All Falling?

Key Market Intelligence for February 5th, how much did you miss out on?

Wintermute: By 2026, crypto had gradually become the settlement layer of the Internet economy
Tether Q4 2025 Report: USDT Market Cap Nears $190 Billion, Multiple Metrics Reach All-Time Highs

Kyle Samani's about-face, one of the biggest believers in web3, has also left the industry

Bhutan Quietly Sells Over $22M in Bitcoin, Drawing Speculation Over Possible Moves
Key Takeaways Bhutan has transferred over $22 million in Bitcoin from sovereign wallets in the past week. The…
BitMine Endures a $7B Unrealized Loss as Ethereum Dips Below $2,100
Key Takeaways BitMine is facing a significant financial challenge with an unrealized loss of over $7 billion in…

Trump-Linked World Liberty Financial Under Scrutiny Following $500 Million UAE Stake
Key Takeaways A U.S. House investigation is examining a $500 million UAE stake in Trump-related World Liberty Financial.…

Asia Market Open: Bitcoin Tumbles as Asian Equities Reflect Global Tech Retreat
Key Takeaways: Bitcoin’s price plunged by 6% to $72,000, reflecting the spillover effects from the global tech sector’s…

Crypto Firms Propose Concessions to Banks as Stablecoin Disputes Stall Key Crypto Bill
Key Takeaways: Crypto companies are attempting to navigate stablecoin disputes with banks but agreements remain elusive. Industry representatives…
CoolWallet Introduces TRON Energy Rental to Minimize TRX Transaction Costs
Key Takeaways CoolWallet has integrated TRON’s energy rental services, offering users lower transaction fees while maintaining asset security.…

CFTC Officially Withdraws Biden-Era Proposal to Ban Political and Sports Prediction Markets
Key Takeaways: The CFTC has rescinded a 2024 proposal and subsequent 2025 advisory that aimed to prohibit event…
$15K+ Profits: The 4 AI Trading Secrets WEEX Hackathon Prelim Winners Used to Dominate Volatile Crypto Markets
How WEEX Hackathon's top AI trading strategies made $15K+ in crypto markets: 4 proven rules for ETH/BTC trading, market structure analysis, and risk management in volatile conditions.